Final $LINK in the corrective chain?If you find this information inspiring/helpful, please consider a boost and follow! Any questions or comments, please leave a comment!
LINK could be finishing a double zigzag correction. Recent reaction at the channel’s most likely target area shows promise. Watching for an internal retrace that holds above key support.
Key Levels:
11.81: Ideal retrace floor
11.00: Break kills impulse idea
13.25: First upside flip needed
15.00: Big level to break for bulls
Bulls have been tricked before with possible impulse starts. This one has the right look and confluence, but caution is warranted. Ideally, we get consolidation and push above 13.25 to build confidence in further upside.
As long as price holds above 11.81 and builds higher lows, potential remains for an impulsive move up. Break below 11 and bias flips back to bearish continuation.
Trade Safe!
Trade Clarity!
LINKUSD trade ideas

Link Usd Long Set upA historical movement from December 2020/ January 2021 might be repeating in real time.
Stops @ 11.59.
Next update when required.

Long trade
📍 Pair: LINKUSD
📅 Date: Monday, June 23, 2025
🕒 Time: 11:00 AM (NY Session AM)
⏱ Time Frame: 4 Hour
📈 Direction: Buyside
📊 Trade Breakdown:
Entry Price 11.892
Profit Level 14.925 (+25.50%)
Stop Loss 11.408 (−4.07%)
Risk-Reward
Ratio 6.27 : 1
🧠 Context / Trade Notes:
High Timeframe Execution:
Trade executed from a 4-hour bullish order block, positioned at the base of a previous impulsive move.
Liquidity Engineering & Sweep:
The setup formed after a sweep below the previous 4H demand, collecting liquidity before reversing direction.

LINKUSDTCryptocurrency Futures Market Disclaimer
Trading cryptocurrency futures involves high risks and is not suitable for all investors. Cryptocurrency prices are highly volatile, which can lead to significant gains or losses in a short period. Before engaging in crypto futures trading, consider your risk tolerance, experience, and financial situation.
Risk of Loss: You may lose more than your initial capital due to the leveraged nature of futures. You are fully responsible for any losses incurred.
Market Volatility: Crypto prices can fluctuate significantly due to factors such as market sentiment, regulations, or unforeseen events.
Leverage Risk: The use of leverage can amplify profits but also increases the risk of total loss.
Regulatory Uncertainty: Regulations related to cryptocurrencies vary by jurisdiction and may change, affecting the value or legality of trading.
Technical Risks: Platform disruptions, hacking, or technical issues may result in losses.
This information is not financial, investment, or trading advice. Consult a professional financial advisor before making decisions. We are not liable for any losses or damages arising from cryptocurrency futures trading.
Note: Ensure compliance with local regulations regarding cryptocurrency trading in your region

ALTCOIN LINKUSDT FORECAST EYES ON 4-7JULY!"Wait until July 4–7. Do not trade next week, as it will be similar to the previous one.
I think Monday will be bearish, followed by bullish days on Tuesday, Wednesday, and Thursday. On Friday, the top will likely be set—then start shorting for the following week."

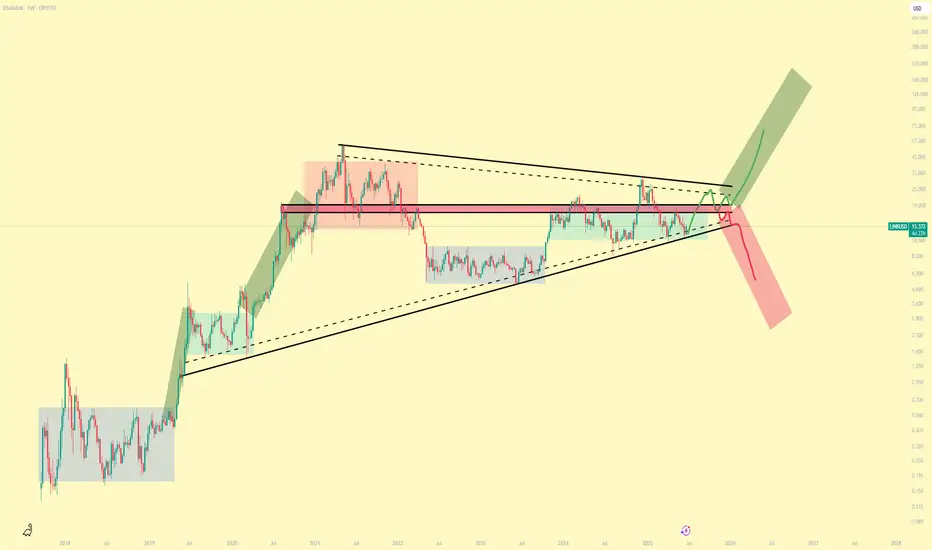
LINKUSD Paths on OfferPretty clear accumulation stages going on and so I am inclined to think we head towards the Bullish path to ~$100
Bears will want to buy LINK at massive discounts and so perhaps we do see some capitulation before our next mark-up phase.
However, the current Total Market cycle patterns, along with the BTC pairing, almost rule out the possibility of further downside, or at least major downside.
LINK about to explodeI believe link is going to lead a massive Bitcoin leg followed by Eth then altcoins. Link tends to start big pushes for Bitcoin. I have seen this happen every single time Bitcoin finds new all-time-highs. The whales are up to something.
TA Wise:
We have a LOT of room for BBWP expansion.
Stochastic RSI is heating up with room.
We note a contracting wedge, with a rising bottom.

LINKUSD – Bullish Momentum Resumes on Daily ChartLINKUSD – Bullish Momentum Resumes on Daily Chart
Chainlink is showing renewed bullish momentum on the daily chart after rebounding sharply from the $13.58 support zone. The price action has reclaimed the $15.30–15.50 resistance area, signaling potential for a continued upward move. MACD is on the verge of a bullish crossover, while RSI is trending higher above the neutral 50 line, confirming growing strength in buyer momentum.
The structure resembles a breakout from a bullish pennant, with a possible target toward $17.95 if momentum holds. Immediate support lies at $14.80 and $13.90. A daily close above $15.60 on strong volume would confirm the bullish continuation.

Chainlink Wave Analysis – 10 June 2025- Chainlink broke daily down channel
- Likely to rise to resistance level 16.00
Chainlink recently broke the resistance trendline of the daily down channel from the start of May (which encloses the previous minor ABC correction 2).
The breakout of this down channel accelerated the active impulse wave 3, which started earlier from the key support level 13.00.
Chainlink can be expected to rise to the next resistance level 16.00 (top of the minor correction ii from the end of May).

ChainLink LINK gearing up for a move back toward $20CRYPTO:LINKUSD found strong buyers in the $14 - $12 equal legs zone after a three #elliottwave pullback, setting the stage for the next upside push.
Momentum is shifting—are you ready for the breakout?

Chainlink 250%Well, had 5 waves up, and a abc (the C had 5 waves) Went perfect to a fib level.
Long term i still think we could go above 100. But for now easy trade tot the 2.618 fib

LINK Bulls Building Toward a Chain ReactionIf you find this information inspiring/helpful, please consider a boost and follow! Any questions or comments, please leave a comment!
LINK just gave us a clean reaction out of an identified box. Bulls may finally be gaining control and a trend shift up is on the table.
We had eyes on this box for a potential reaction. The market delivered. Now bulls need to prove they can build on it. The first key is to defend 13.284. As long as this level holds, the case for a higher trend remains alive.
Next, bulls need to clear 14.47. That is the first smaller degree LH that must be taken out to confirm that buyers are pushing through the structure.
The big step remains 15.00. This has acted as a major flipping level. A true test for the bulls will be whether they can reclaim and hold above it. If they do, the door opens for stronger upside follow through.
The path is clear:
💥 Hold 13.284
💥 Break 14.47
💥 Reclaim 15.00
We will continue to track this closely with the Elliott Scanner mindset. If momentum picks up through these levels, this could become an attractive higher-degree setup.
Watch these levels carefully. Bulls have work to do, but the ingredients for a shift are building.
Trade Safe!
Trade Clarity!
LINK: Last Buying Opportunity & Stablecoin SuperCycle Part 1Chainlink has printed a weekly bullish hammer after testing the blue fibbonaci retracement support area. This is further evidence that Wave 2 (Green) has bottomed or close to bottoming, and that Wave 3(Green) to the upside is happening soon. A common target for an ABC (White) correction is the 1.618 trend based fib extension at $121.15.
I uploaded a video on Youtube concerning Stablecoin Adoption and Chainlink's Proof of Reserves (POR) role in stablecoin infrastructure that TradingView isn't allowing me to publish.

Weekly trading plan for LINKBINANCE:LINKUSDT has fallen quite low after the upward correction, but in case the local trend turns green, I will consider long positions with the aim to break PP and reach the first resistance level, and then we will see
Locally, a trend line can be drawn and if it is broken, there is a high probability to renew the local bottom and reach the 0.618 Fibonacci level
Important levels and possible price movement are explained in the video
Write a comment with your coins & hit the like button and I will make an analysis for you
The author's opinion may differ from yours,
Consider your risks.
Wish you successful trades ! mura

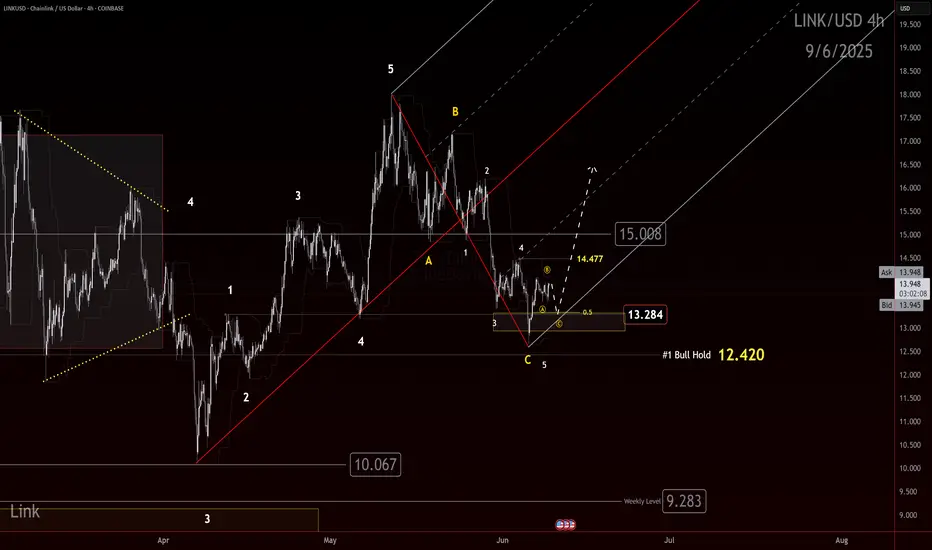
Link Correction complete? CRYPTOCAP:LINK Correction Nearing Completion? Key Levels to Watch
Recap
CRYPTOCAP:LINK continues to retrace and lose levels. Price action looks a bit incomplete on the Elliott wave side, but technicals suggest the retracement may be nearing its end.
The Setup
The cleanest scenario would see price make one more leg down into the 12.42 area. That level offers symmetry and structural balance for a completed correction.
If instead price breaks above 15.008, it opens the door for the correction to be considered complete. Still, confirmation would require a strong reaction from that move—not just a quick wick.
The Outlook
A defense of 12.42 would keep the bullish scenario alive. A break below that level, however, would weaken the outlook and raise the probability of an extended correction or trend continuation lower. Namely an impulsive move down. Right now, we have a potential correction, we need the PA to provide proof of what we have. Wave 4s and 5s at matching degrees as what has printed are need to prove an impulse and an invalidation will prove otherwise.
For now, the focus remains on reactions at these two levels. Watch closely— CRYPTOCAP:LINK could be setting up its next directional move.


Weekly trading plan for LINK In this idea I marked the important levels for this week and considered a few scenarios of price performance
The price may be in a triangle-type correction now, that's why the video noted in detail the possible scenario
Write a comment with your coins & hit the like button and I will make an analysis for you
The author's opinion may differ from yours,
Consider your risks.
Wish you successful trades ! mura


The Greatest Chainlink Bar Pattern in History: The Crystal Ball For over 700 days now, following this Chainlink bar pattern has been the most profitable bar pattern I have ever found since I began this journey — it’s literally been a map of the future.
But for the first time, there has been a massive deviation. Let me explain.
We must go back to August 2020.
According to the bar pattern, we’ve just completed the same move from August 2020 — but the big difference here is that this time, it’s taken over 100 days to complete, while in 2020 it took just 30 days.
So far this cycle, it's the biggest deviation yet. Which has me thinking: what if this cycle breaks the four-year cycle and we extend beyond the 1,064-day cycle that's supposed to complete in October 2025?
Without this recent deviation, Chainlink would have completed the cycle bar pattern in August 2025.
My Chainlink Time Fib has a hit on this time period — August 2025. Something could happen around this time. This Time Fib has had major calls before, although it has also failed in the past.
The new deviated timeline for the cycle top:
This is what it would look like if the deviated bar pattern was shifted. Could this be a major clue showing us the future again? Are we catching a glimpse of what’s to come?
According to this new timeline, Chainlink rallies slowly until October 2025 — which lines up with Bitcoin’s cycle completion date. Bitcoin has never passed 1,064 days in a bull market. The last two cycles took exactly that long. So it’s interesting that price appears to grind upward to that date and then roll over.
It continues to roll over and apparently has a major retest of the lows:
This shows a retest of $10 in December 2025 — forming what could be the biggest bear trap in history — before a massive rally in 2026 leading to a March 2027 top.
I’ll be watching Chainlink like a hawk this year. So far, it has led the way for me and made this cycle pretty easy to read. Is it possible that the major run happens in 2026?
Stay safe, marines. 🫡

Chainlink will explode this cycleChainlink has been moving sideways for the last couple of years. Fundamentally, it is one of the few entities well-positioned to dominate the space. CCIP furthers Chainlink's dominance with a stronger use case and incentives built in for users to pay with Link. With the plethora of blockchains continuing, it is obvious that no one blockchain will rule them all and Chainlink CCIP will the the standard for cross-chain transactions.
Fundamentals aside, I am a technical trader, and the fundamentals allow me to invest with little fear, however, the trader in me salivates at this chart.
I have observed that tight pivot points cause explosive upside movement. In this chart, we have the one-year, two-year, and three-year pivots, stacked on top of each other with the Bollinger band centerline and linear regression line threading them. This indicates that any further upside in price could likely trigger huge upside when this MA crosses these pivots. With three pivots, fueling the price action, what you are seeing is essentially a launchpad that will send Link to the moon. I am expecting 5x plus easy in the next 16 months, but I would not be surprised to see Link eclipse all the resistance points in the 3-year chart relatively quickly.

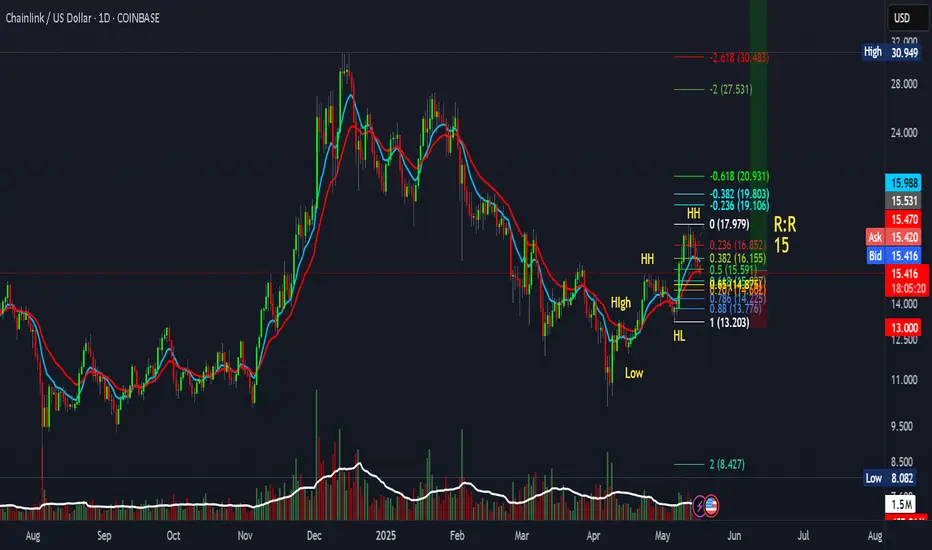
LINK Daily – Golden Zone Long Opportunity | 15:1 R:RChainlink (LINK) is currently retesting the 0.5 Fibonacci retracement level (~$16) on the daily chart, offering a promising long entry. There's still potential for a deeper pullback into the golden zone (0.618–0.65 Fib) near $15, which could serve as a second entry to average in.
This is a high R:R setup, ideal for spot buyers or swing traders looking to accumulate before a possible move higher.
🔹 Entry Zone: $16 (initial) | $15 (golden zone)
🔹 Stop-loss: Just below the previous higher low
🔹 Target: All-Time High (hopium target 🌕)
🔹 Risk-to-Reward: ~15:1
BTC is currently holding key support in the $102K–$104K range. If this level holds, LINK could be bottoming here before the next leg up.
Now might be a strategic time to enter or scale your position before strength returns.
ALTCOIN BOOM FOR CHAINLINK 2025-2026 PROPOSALWhy This Asset?
Core Info: Chainlink is the decentralized oracle network that bridges blockchains with real-world data (price feeds, weather, sports scores), enabling smart contracts to operate autonomously. It’s the critical infrastructure for DeFi, gaming, insurance, and beyond.
Recent News:
Cross-Chain Interoperability Protocol (CCIP) launched on Base (Coinbase’s L2) and other chains, streamlining cross-chain token transfers.
Partnership with DTCC (the $2 quadrillion securities settlement giant) to pilot real-world asset (RWA) tokenization.
Deep Dive:
Chainlink is capitalizing on two seismic shifts:
Institutional Adoption: DTCC’s collaboration signals TradFi’s growing reliance on blockchain infrastructure.
Multichain Dominance: CCIP’s expansion solves crypto’s fragmentation issue, making LINK indispensable for cross-chain interoperability.
Latest Tech/Utility Update
Update: CCIP mainnet launch + upgraded staking v0.2 (supports more node operators, boosts rewards).
Implications:
For Users: Cross-chain swaps become cheaper and faster, rivaling LayerZero and Wormhole.
For Investors: Only 8% of LINK is staked. If adoption accelerates, reduced supply + rising demand could trigger deflationary pressure.
Biggest Partner & Investment
Partner Spotlight: SWIFT, the global banking messaging network, tested CCIP with 10+ major banks for cross-border transactions.
Deal Size: Undisclosed, but SWIFT’s network spans 11,000+ banks. Integration could funnel trillions into blockchain.
Impact: SWIFT’s involvement isn’t just a partnership… it’s a gateway for TradFi liquidity. Chainlink is now the backbone for both DeFi and legacy finance.
Most Recent Added Partner
New Collab: Avalanche integrated Chainlink Data Streams for high-speed DeFi pricing.
Why It Matters: Avalanche’s institutional subnets (e.g., JPMorgan’s Onyx) now rely on Chainlink for hyper-accurate data. LINK solidifies its role as the oracle for performance-focused chains.
Tokenomics Update
Changes:
Staking v0.2 offers 5-8% APY but requires longer lockup periods.
Total supply remains fixed at 1B tokens (no inflation).
Analysis:
Staking upgrades reduce sell pressure, but 40% of tokens are still held by early investors. Gradual unlocks could cause short-term volatility, though institutional demand (e.g., SWIFT/DTCC) might absorb it long-term.
Overall Sentiment Analysis
Market Behavior: Accumulation phase. LINK surged 40% since June (13 or 13−15 range), with whale wallets growing steadily.
Driving Forces:
Bullish: CCIP adoption + SWIFT/DTCC hype.
Bearish: Rising competition (Pyth Network, API3) in the oracle space.
Insight: Sentiment is cautiously bullish. Chainlink’s first-mover advantage is strong, but it must keep innovating to fend off rivals.
Recent Popular Holders & Their Influence
Key Investors:
Wintermute (crypto’s top market maker) boosted LINK holdings by 12% this month.
Cobie, a crypto influencer, tweeted: “LINK is the oracle blue-chip.”
Why Follow Them: Wintermute’s moves often signal institutional positioning. Cobie’s endorsement fuels retail momentum.
Summary & Final Verdict
Recap: Chainlink is the glue connecting DeFi, TradFi, and multichain ecosystems. CCIP, SWIFT/DTCC deals, and staking upgrades create a perfect storm of utility and demand.
Verdict: LINK is a long-term hold with asymmetric upside. It’s not a meme coin, but its dominance in oracles (60%+ market share) makes it a cornerstone of crypto’s future. Risks include token unlocks and Pyth Network’s growth.
Final Thought: If you’re betting on blockchain infrastructure becoming mainstream, LINK is essential. If you want hype-driven pumps, look elsewhere.

LINKUSD: Expected to give +100% return.Chainlink has turned overbought on its 1D technical outlook (RSI = 70.291, MACD = 0.870, ADX = 19.937) and has validated the start of the new bullish wave of the Channel Up as it crossed above both the 1W MA200 and MA50. Both prior bullish waves rose by nearly +300%, the most recent by +275%. Technically it can repeat at least that and double in price (TP = 35.00) before the wave peaks at the top of the Channel Up.
## If you like our free content follow our profile to get more daily ideas. ##
## Comments and likes are greatly appreciated. ##
