LINKUSD Potential For Bullish Rise | 24th February 2023Looking at the H4 chart, my overall bias for LINKUSD is bullish due to the current price being above the Ichimoku cloud, indicating a bullish market. Looking for an immediate buy entry at 7.895, due to price bouncing off the overlap support at 7.503 strongly, indicating that the bullish momentum is strong. Stop loss will be at 7.503, where the previous overlap support and 38.2% Fibonacci line is. Take profit will be at 9.480 where the previous swing high was.
Any opinions, news, research, analyses, prices, other information, or links to third-party sites contained on this website are provided on an "as-is" basis, as general market commentary, and do not constitute investment advice. The market commentary has not been prepared in accordance with legal requirements designed to promote the independence of investment research, and it is therefore not subject to any prohibition on dealing ahead of dissemination. Although this commentary is not produced by an independent source, FXCM takes all sufficient steps to eliminate or prevent any conflicts of interest arising out of the production and dissemination of this communication. The employees of FXCM commit to acting in the clients' best interests and represent their views without misleading, deceiving, or otherwise impairing the clients' ability to make informed investment decisions. For more information about the FXCM's internal organizational and administrative arrangements for the prevention of conflicts, please refer to the Firms' Managing Conflicts Policy. Please ensure that you read and understand our Full Disclaimer and Liability provision concerning the foregoing Information, which can be accessed on the website.
LINKUSD trade ideas

LINK: Oracles have been really quietLINK has been consolidating for 287 days. This coiling of price action is going to lead to an explosive breakout any day now. LINK also crossed its 2.618 fib ring, and found support again on its 1.618 fib channel line. History doesn't have to repeat itself, but last time LINK crossed the 2.618 fib ring it pumped 150%.
LINK/BTC is in an bullish accumulation structure finding support on the .618 fib. Last obstacle is closing above the long term trend line before breakout.

LINK - The sideways man, the sideways manIt can go sideways fast as you can. Link has been going sideways for quite some time and hasn't had the strength to break out of this range or break above the 50, which is now in the range. We might see some more downside, but if it does travel to the lower reaches of the horizontal range, I think in a few weeks it will make another try to break the 50. It's due for a pump, but LINK always seems to pump when the market tanks.

Whats happening with Chainlink?To say that the trajectory of Chainlink in the past eight months has been anything but surprising would be an understatement - unfortunately, the surprises have not been in the coin's favor. Despite having one of the strongest fundamentals in crypto, its pattern, price range, and movements have been quite unusual in my opinion. It has broken all trend lines and channels from its genesis, and there are no historical patterns to compare it to.
Last year, I was setting up for one of my biggest trades with Chainlink, as the price was perfectly aligned with my Fibonacci time sequence. However, the FTX black swan event occurred, and since then, it hasn't quite recovered like the rest. You can check out those failed TA's under "Related ideas" below.
While other coins in the market have seen massive rallies of hundreds of percentages, Chainlink hasn't done much, only up 33% from its lows. This brings me to a new channel that I will be testing out this year. If anyone has any other channels from genesis, please let me know by clicking on the link below.
There isn't much to go on with Chainlink until we break the resistance seen below. It's been 245 days and four attempts, but we've never managed to close above it.
The LMACD on the 3-week timeframe is showing momentum coming up, but the price is going down, indicating that divergence is building.
The LINK/BTC dominance chart has always been the most crucial chart to trade Chainlink, as you can see from the chart. Currently, we're sitting in the same place before we had a massive run of 124% in price back in January 2020. The resistance was broken at one point, and we even closed a weekly above it, but then failed to hold it as support due to the FTX black swan.The big Chainlink move comes once we have a clear break from this resistance, which it has been stuck under for 917 days.
Using this Fib time sequence, we knew that the bottom was in for Chainlink.
I have been using this Fib sequence on the dominance for years, going back as far as 2019 when i was trading LINK I used this channel.
For the past 280 days, the price has been ranging, and there have been a lot of good trades in the $5 dollar range. However, now we want to see it break out!


LINKUSDT <Wyckoff pattern>The formation of the Wyckoff pattern in the chart
Considering the formation of the Wyckoff pattern and the price being in the last phase of this pattern, we can expect the failure of the swing range.

This is called a price rectangle. $LINKWhichever way this pattern is resolved should set the direction and magnitude of ensuing trend.

Link looking to to test range highsLink has been an accumulation phase for around 8 months, it has just broken out and i see this testing $9.30 at least.
SR flip of $7.80 is further confluence of a long trigger.

LINK: market loves LINKOne look at the chart from the last week and first thought is that the market just loves LINK. This is one of the best performing altcoins during the increased market optimism which was evident during the previous week. Although LINK started the week struggling around $6,5 level, the price soon went to the higher grounds, breaching the $7 resistance and ending the week by testing next resistance at $8,0. For some time in the past, we have been mentioning that investors see high potential in this coin, and its increasing use among crypto practitioners and networks.
RSI indicator started the week below 50, but it is clearly heading toward the overbought side of the market. Currently, the indicator stands at level of 65, missing 5 points until the clear overbought market side is reached. Moving averages of 50 and 200 days started to modestly converge toward each other. There is still distance between them, but at least there is some indication that a potential cross might occur some time soon.
LINK had a strong push in price during the previous week, in which sense, if some short reversal occurs in the coming days, it should not be a huge surprise. On the other hand, there are still prevailing buying orders as of the end of the week, which might push the price even to the level of $8,5 during the week ahead. It should be taken with precaution, as short reversal also might occur, at least to the level of $7,5, with low probability that support at $7 might be tested.

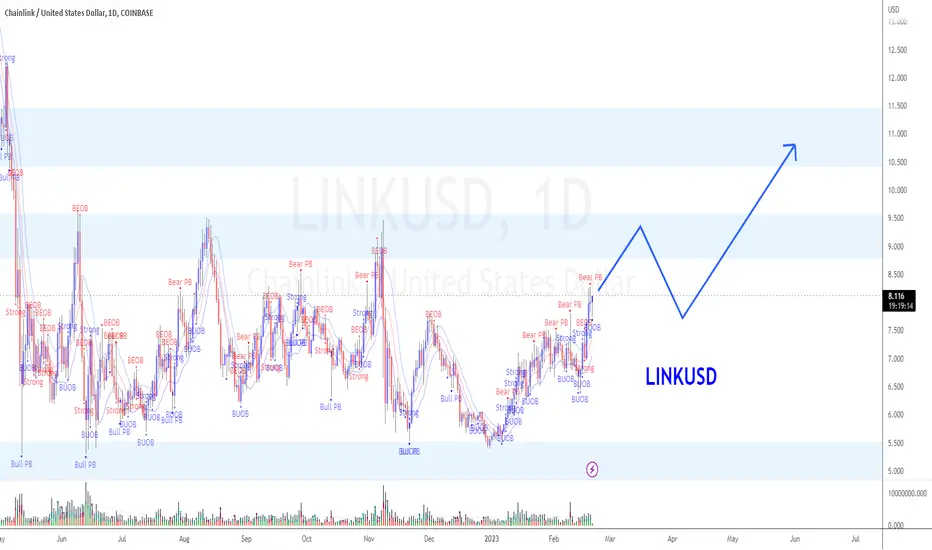
Crypto ChainLink (Overdue Breakout is upon us)View On ChainLink LINK/USD (20 Feb 2023)
Crypto ChainLink LINK/USD is mainly in the big swing mode for the nearly a year now.
I reckon we are in for the BULLish mode as the low regions such as $5~$5.5 are accompanied by the strong rebound with big volume.
We have better odd in staying on the Buy side.
It should retest $9.25 region and $11 region soon.
Let's see.
DYODD, Our trade analysis may not suitable to intraday (or) short time frame trading.
Whatever method you use if you do not follow the proper rule of risk management, it will have detrimental effects on your account.
Feel Free to "Follow", press "LIKE" "Comment".
Legal Risk Disclosure:
Trading foreign exchange or CFD on margin carries a high level of risk, and may not be suitable for all investors.
The high degree of leverage can work against you as well as for you. Before deciding to trade foreign exchange you should carefully consider your investment objectives, level of experience and risk appetite.
The possibility exists that you could sustain a loss of some or all of your initial investment and therefore you should not invest money that you cannot afford to lose.
You should be aware of all the risks associated with foreign exchange trading, and seek advice from an independent financial advisor.
DISCLAIMER:
Any opinions, news, research, analyses, prices or other information discussed in this presentation or linked to from this presentation are provided as general market commentary and do not constitute investment advice.
Sonicr Mastery Team does not accept liability for any loss or damage, including without limitation to, any loss of profit, which may arise directly or indirectly from use of or reliance on such information.
LINK: $2.75 | with Google & the rest of the Team. SWEETsee you at fresh highs and maybe just maybe hit that $100bn cap mark
paring with SAP ORACLE and AMAZON


✴️ Chainlink 5X Lev. (~100% to 390% Potential)My dear friends, I am back providing you with great content... The intention is to share my view and opinion and for us all to learn and be entertained.
Trolls... Stay away, this is for true followers only and responsible, adult, conscious people.
If you don't know how to approach a lev. trade then please, stay away, do your research first, study because I am no financial advisor.
This is my view of the charts and trading involves risks regardless if you buy with or without leverage/margin, crypto or stocks or anything.
In fact, most everything in life posses some sort of risk, so keep in mind that each individual human being, soul, is responsible for his/her own actions.
I am writing all this because people will troll me in the comments section saying it is illegal to share my ideas... Trade ideas... It is just that, an idea.
This can be a success or a failure... That is for the market to decide.
What we know for certain is the potential vs risk.
The market situation, how the chart is looking, etc.
We are live with 5X on LINKUSD.
I will share the trade numbers with you:
-----
LONG LINKUSD 5X
Entry: 6.10-6.60
Stop: Close daily below 5.75
Liquidation: 5.226
Targets:
1) 7.10
2) 7.70
3) 8.20
4) 9.0
5) 10.0
6) 11.5
Capital allocation: 3%
Potential profits: 390%
-----
Trading with lev. is high risk and recommended for experts only.
If you are a beginner start with spot trading and once you are successful at it for 2-3 years then make the leap.
If you want to start right away be aware that there is a price to pay to learn.
Liquidation can result in your entire position being lost.
If one cannot take a loss, one cannot trade.
Losing is part of the game as much as winning... In fact, we tend to lose more than we win overall... But we win in the end if we learn from our mistakes.
Thank you for your continued support.
Feedback is appreciated in the comments below.
Namaste.

LINK Block Theory 25% move incoming if daily closes @ 7.80Not financial advice
We currently have taken out a 25% block on the daily.
And if we get a daily close above 7.80 the 1st take profits is 9.72 according to the block theory...
Staying above 7.80 on the daily we can aim for as high as 13.77 according to fib extension on this shorter timeframe of the daily.
Again DYOR
Always practice patience
#PIK
Patience is Key
#TLAW
Think Like A Whale

link graphic updatelink long term scenarios:
I'll be adding updates to these posts :)
link is in an indefinition zone, apparently the sellers have reduced their offers and link can break the rectangle upwards, making a movement in corrective abc, the yellow lines are the possible bullish and bearish targets.
comment there what is your position regarding this vision; )

$LINK Stage Analysis - TextbookWe are in Stage 1 awaiting a stage 2 breakout. Bigger the base, the higher in space.

✴️ Chainlink Still Within Consolidation Box (165%+ Potential)Chainlink (LINKUSD) is still trading near its bottom, literally still sideways within its consolidation box.
While our leveraged trade is already way ahead in profits, the true action is yet to start.
19-Jan. ✴️ Chainlink 5X Lev. (~100% to 390% Potential)
Lets have a look at the different resistance levels.
We have 7.917 as immediate resistance, easy to takeout.
This is followed by EMA50 at 10.25, easy since we've seen other pairs flying through this barrier.
We have 12, 16 and 20... The full details can be found in the trade idea above.
Thank you for reading.
Namaste.

Bull on Link<3
Passed bull season and went straight to tax season.
These closing triangles are very distinct. It will only take one breakout and the price will never get close to the triangle again. Going long, holding until the real metaphorical bulls run the market up. Going short, it might hit this current channel again.

Stink It!Sorry I meant send it!, It appears that the bottom is in here and we have completed a large wave 1-2 and may be in the early stages of wave 3 - Expect a parabolic rise if so.


LINKUSD - Channel PleaseA sideways 80% range channel right near 2019 and 2020 highs would be ideal to build a base. Buy low, sell high until it breaks out.
Give to me.

LINK: slow movesIt was a relatively modest week for LINK. There was a general negative market sentiment on the crypto market, so LINK could not make any sort of general moves, instead, the coin was slowly moving between levels of $7.2 and $6.7. There has been an interesting development on Thursday, when the price suddenly moved till level of $7.8, which has been followed with significantly increased trading volumes. However, the price swiftly reverted to previous levels. Although there is no further information on this transaction, it still to some extent shows that LINK has a strong potential.
The RSI indicator moved to the down side, but it is still holding modestly above the level of 50. It shows that the market is still not ready to head toward the oversold side. Moving averages of 50 and 200 days continue their dance as two parallel lines, which lasts from December 2021, still not providing any glimpse that the long awaited cross might occur any time soon.
Current charts are pointing that LINK might continue with its slow motion moves also in the coming period. Certainly, the resistance line at $7.0 is currently tested and is going to be tested during the following days. On the opposite side, $6.7 might be a short term stop for one more time, with decreased probability for $6.5 support.

LINKUSD Is it finally moving?Chainlink is consolidating around the 1day MA200, being slightly more bullish as the 1day MA50 is holding. Today's highly volatile 1day candle is evidence that the market is prepared to move higher. The Channel Down on the RSI could be a Bull Flag as it was in October.
We are buyers with 8.200 the short term Target. Next buy above Resistance A with our Target a bit lower than Resistance B at 9.4500.
In the same sense, below Support A, we turn to selling with 5.7000 our Target.
Follow us, like the idea and leave a comment below!!
