ChainLink · Short-Term Correction (Retrace) · 2025 Bull MarketWe have evidence that ChainLink won't be moving much lower. There are mainly two reasons: 1) There aren't that many sellers and 2) we have strong support. We have an active support range between $14.5 and $15.95. This is the reversal point. Either current prices or this lower range which shows an in
Related pairs

LINK - The sleeping Giant ready to wake!Don't forget to add LINK to your watchlist — it's a solid project with long-term investment potential.
The weekly chart shows that LINK is currently retesting the downtrend line it recently broke — a textbook bullish retest.
The lower trendline now acts as a key support level, and as long as price

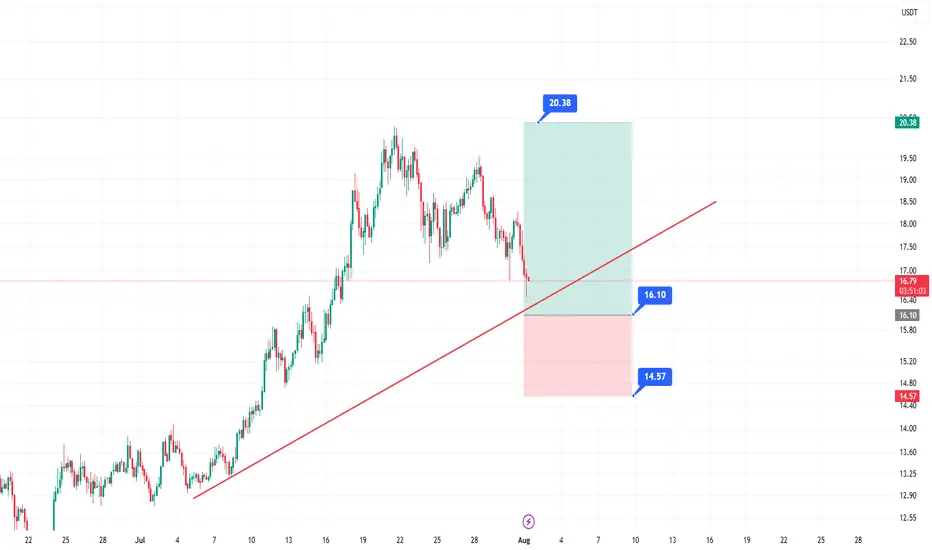
Chainlink (LINKUSDT) has shown strong bullish momentumKey Points
It seems likely that a long entry for LINKUSDT at $15.70–$16.10 using a limit order is a valid strategy, given recent bullish trends and technical support levels.
The take profit at $20.38 and stop loss at $14.57 suggest a favorable risk-reward ratio, but market volatility could affect ou
LINK Targets $21.60 with Bullish MomentumLINK Targets $21.60 with Bullish Momentum
After Bitcoin’s explosive surge to $118800, the entire crypto market is on fire, and Chainlink (LINK) is one of the standouts.
LINK has broken out of a well-defined bullish pattern and continues its upward push since yesterday.
If you're already in the

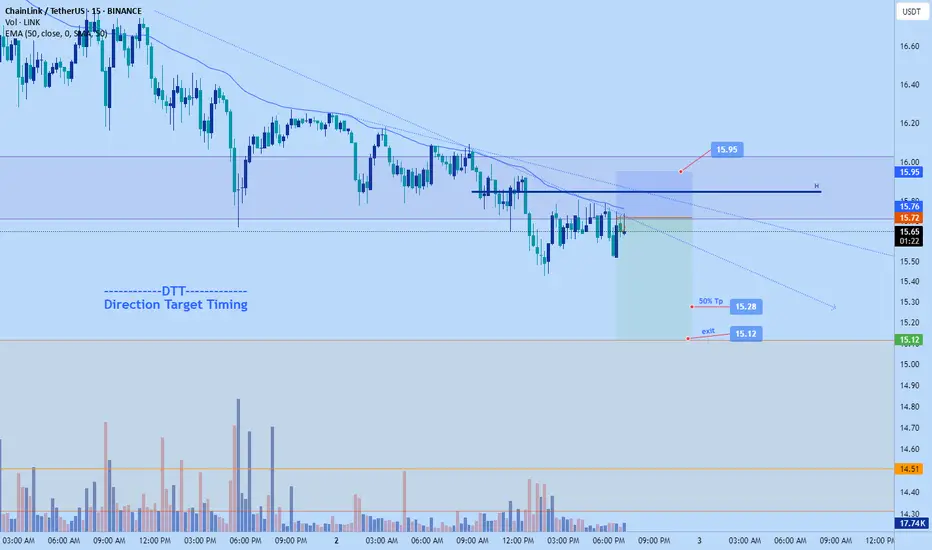
Chainklink further dump to $15.12Just now opened a short position on chainlink.
Aiming for $15.12 area
2-2.61RR
DTT strategy applied.
Time sensitive
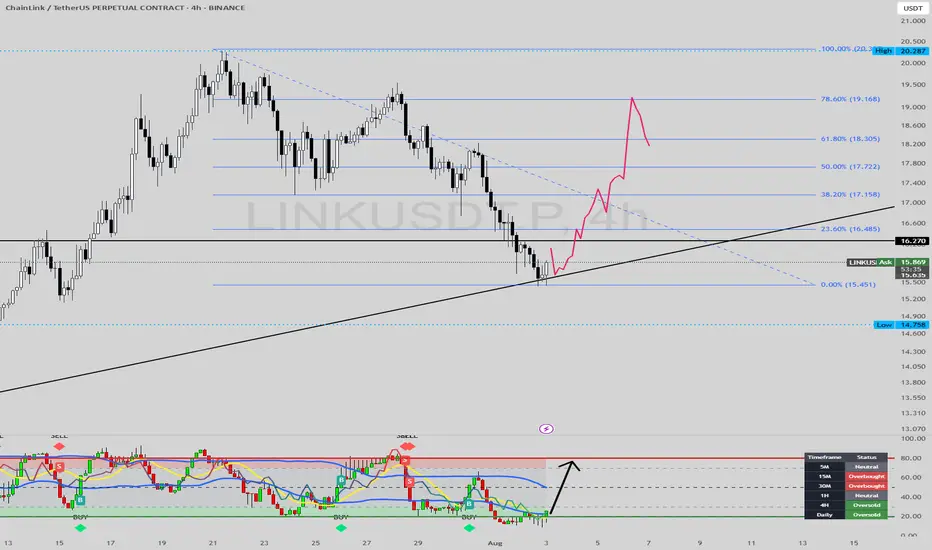
LINK 4H – Bounce from the 0.5 Fib, Eyes on $21Chainlink just posted a clean reaction off the 0.5 Fibonacci retracement (16.76), reclaiming trend structure after a sharp pullback.
The last time LINK bounced from this zone, it ripped straight through resistance. Now we’ve got:
Strong support reaction off the 0.5 Fib
Higher low forming inside s

ChainLink LongFollowing a significant decline, the asset will take support and bounce back from this point.
Disclaimer: This is not financial advice.
This algorithm provides highly precise buy and sell signals with alerts:
LINK : You want the link for the pump?Hello friends🙌
✅considering the recent market decline, the LINK market has also fallen like other currencies, and many of you are afraid that this is the end and the rise is over or is there still a rise?
✅Well, as we have indicated on the chart, after the price fell to the support area marked wi

LINK/USDT: A+ Long Setup at Key Support with Daily OversoldHello traders,
I am monitoring a high-probability long setup on LINK/USDT on the 4H timeframe. The chart is presenting a classic reversal scenario where multiple technical factors are aligning perfectly, suggesting the recent corrective move may be over.
1. Trend & Context (The "Why")
After a
Link targeting 30$In my view after a deeper retracement to 0.618 fibonacci level , about 16.3$, Link bullish trend will resume to target 30.4$

See all ideas
Summarizing what the indicators are suggesting.
Oscillators
Neutral
SellBuy
Strong sellStrong buy
Strong sellSellNeutralBuyStrong buy
Oscillators
Neutral
SellBuy
Strong sellStrong buy
Strong sellSellNeutralBuyStrong buy
Summary
Neutral
SellBuy
Strong sellStrong buy
Strong sellSellNeutralBuyStrong buy
Summary
Neutral
SellBuy
Strong sellStrong buy
Strong sellSellNeutralBuyStrong buy
Summary
Neutral
SellBuy
Strong sellStrong buy
Strong sellSellNeutralBuyStrong buy
Moving Averages
Neutral
SellBuy
Strong sellStrong buy
Strong sellSellNeutralBuyStrong buy
Moving Averages
Neutral
SellBuy
Strong sellStrong buy
Strong sellSellNeutralBuyStrong buy
Displays a symbol's price movements over previous years to identify recurring trends.
Frequently Asked Questions
The current price of ChainLink / TetherUS (LINK) is 16.90 USDT — it has risen 1.95% in the past 24 hours. Try placing this info into the context by checking out what coins are also gaining and losing at the moment and seeing LINK price chart.
ChainLink / TetherUS price has fallen by −6.39% over the last week, its month performance shows a 23.80% increase, and as for the last year, ChainLink / TetherUS has increased by 67.99%. See more dynamics on LINK price chart.
Keep track of coins' changes with our Crypto Coins Heatmap.
Keep track of coins' changes with our Crypto Coins Heatmap.
ChainLink / TetherUS (LINK) reached its highest price on May 10, 2021 — it amounted to 53.00 USDT. Find more insights on the LINK price chart.
See the list of crypto gainers and choose what best fits your strategy.
See the list of crypto gainers and choose what best fits your strategy.
ChainLink / TetherUS (LINK) reached the lowest price of 0.35 USDT on Jan 28, 2019. View more ChainLink / TetherUS dynamics on the price chart.
See the list of crypto losers to find unexpected opportunities.
See the list of crypto losers to find unexpected opportunities.
The safest choice when buying LINK is to go to a well-known crypto exchange. Some of the popular names are Binance, Coinbase, Kraken. But you'll have to find a reliable broker and create an account first. You can trade LINK right from TradingView charts — just choose a broker and connect to your account.
Crypto markets are famous for their volatility, so one should study all the available stats before adding crypto assets to their portfolio. Very often it's technical analysis that comes in handy. We prepared technical ratings for ChainLink / TetherUS (LINK): today its technical analysis shows the buy signal, and according to the 1 week rating LINK shows the strong buy signal. And you'd better dig deeper and study 1 month rating too — it's strong buy. Find inspiration in ChainLink / TetherUS trading ideas and keep track of what's moving crypto markets with our crypto news feed.
ChainLink / TetherUS (LINK) is just as reliable as any other crypto asset — this corner of the world market is highly volatile. Today, for instance, ChainLink / TetherUS is estimated as 2.05% volatile. The only thing it means is that you must prepare and examine all available information before making a decision. And if you're not sure about ChainLink / TetherUS, you can find more inspiration in our curated watchlists.
You can discuss ChainLink / TetherUS (LINK) with other users in our public chats, Minds or in the comments to Ideas.