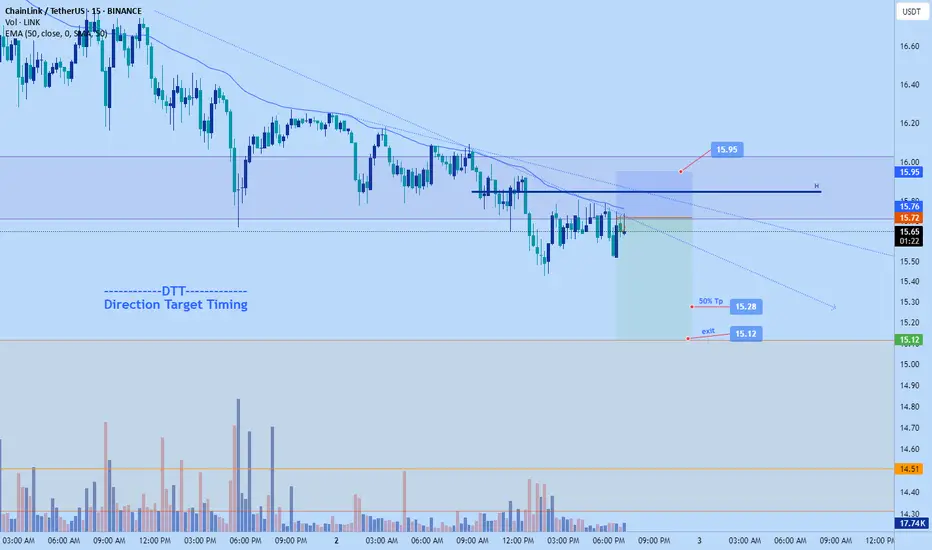
LINK SHORT It seems like a lower high has now formed. Following the trend positioning into a short position makes sense here.
LINKUSDT.3L trade ideas

LINK Targets $21.60 with Bullish MomentumLINK Targets $21.60 with Bullish Momentum
After Bitcoin’s explosive surge to $118800, the entire crypto market is on fire, and Chainlink (LINK) is one of the standouts.
LINK has broken out of a well-defined bullish pattern and continues its upward push since yesterday.
If you're already in the trade, consider holding your position, as LINK shows strong potential to reach $17.60, $19.60, and possibly even $21.60.
If you're not yet in, an ideal entry zone to monitor is around $14.00 to $14.50.
Momentum remains strong, and the breakout structure supports further upside.
You may find more details in the chart!
Thank you and Good Luck!
PS: Please support with a like or comment if you find this analysis useful for your trading day

Chainklink further dump to $15.12Just now opened a short position on chainlink.
Aiming for $15.12 area
2-2.61RR
DTT strategy applied.
Time sensitive
ChainLink · Short-Term Correction (Retrace) · 2025 Bull MarketWe have evidence that ChainLink won't be moving much lower. There are mainly two reasons: 1) There aren't that many sellers and 2) we have strong support. We have an active support range between $14.5 and $15.95. This is the reversal point. Either current prices or this lower range which shows an intersection between two strong moving averages as well as Fib. retracement levels.
The rise between June and July has a stronger slope compared to the one before. The April-May rise was more spread out and so the correction lasts longer. The present one has a stronger slope, it is more steep, and thus a retrace will have a shorter duration because prices will continue growing.
Volume is extremely low on the drop and bearish momentum is not present. There can be one final flush reaching the levels mentioned above or lower on a wick and the market turns. The flush would make everything seen pretty bad and red but the truth is that this would be the end. When the major sell is in, the market turns around and moves the other way.
LINKUSDT is retracing within a bullish bias mid-term. Long-term growth is possible based on the bigger picture.
LINKUSDT is facing an intersection of multiple support zones, if these levels hold, we can see a resumption of the bullish move and prices grow. Each time a retrace is over, the bullish wave that follows will be many times stronger than the previous one until the bull market ends.
We are still looking at bottom prices. The best is yet to come.
Namaste.

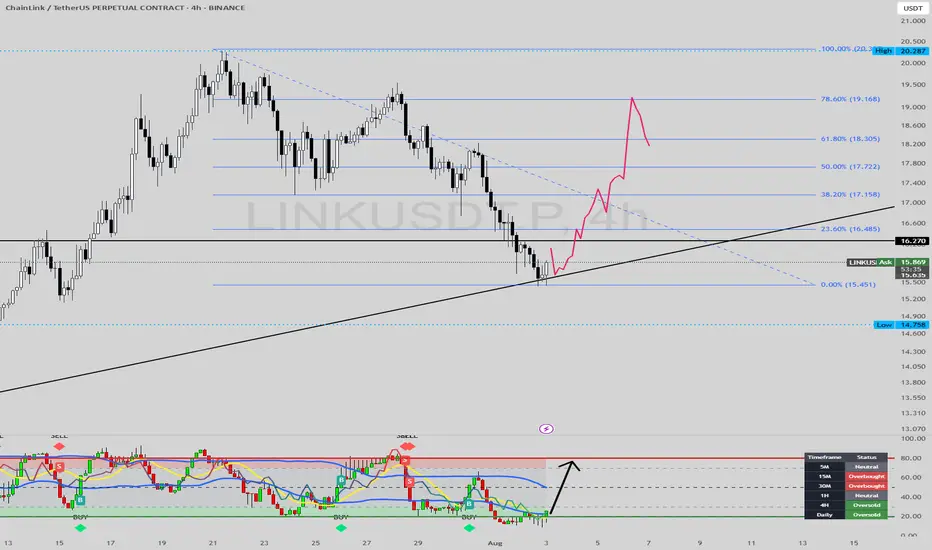
LINK 4H – Bounce from the 0.5 Fib, Eyes on $21Chainlink just posted a clean reaction off the 0.5 Fibonacci retracement (16.76), reclaiming trend structure after a sharp pullback.
The last time LINK bounced from this zone, it ripped straight through resistance. Now we’ve got:
Strong support reaction off the 0.5 Fib
Higher low forming inside structure
Stoch RSI resetting from oversold
Clear measured move potential toward $21.00
This setup gives a defined invalidation zone just below 16.50, with upside targeting the previous high and beyond.
🔍 Key Levels:
Support zone: 16.76–15.93
Target 1: 19.50
Target 2: 21.08
Invalid if we lose 15.80 with momentum breakdown

LINK : You want the link for the pump?Hello friends🙌
✅considering the recent market decline, the LINK market has also fallen like other currencies, and many of you are afraid that this is the end and the rise is over or is there still a rise?
✅Well, as we have indicated on the chart, after the price fell to the support area marked with Fibonacci, a double bottom pattern was formed and then the price was increased by buyers.
✅In this wave, we drew another Fibonacci and identified the area where the price pulled back, and we believe this currency has good potential for growth.
✅Now you can buy in steps in the specified areas with capital and risk management and move to the specified targets.
🔥Follow us for more signals🔥
*Trade safely with us*

ChainLink LongFollowing a significant decline, the asset will take support and bounce back from this point.
Disclaimer: This is not financial advice.
This algorithm provides highly precise buy and sell signals with alerts:
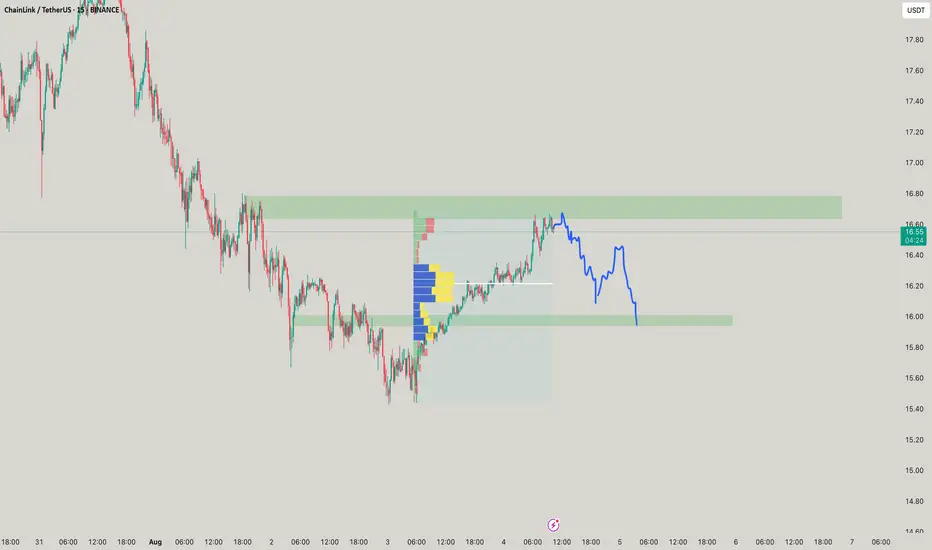
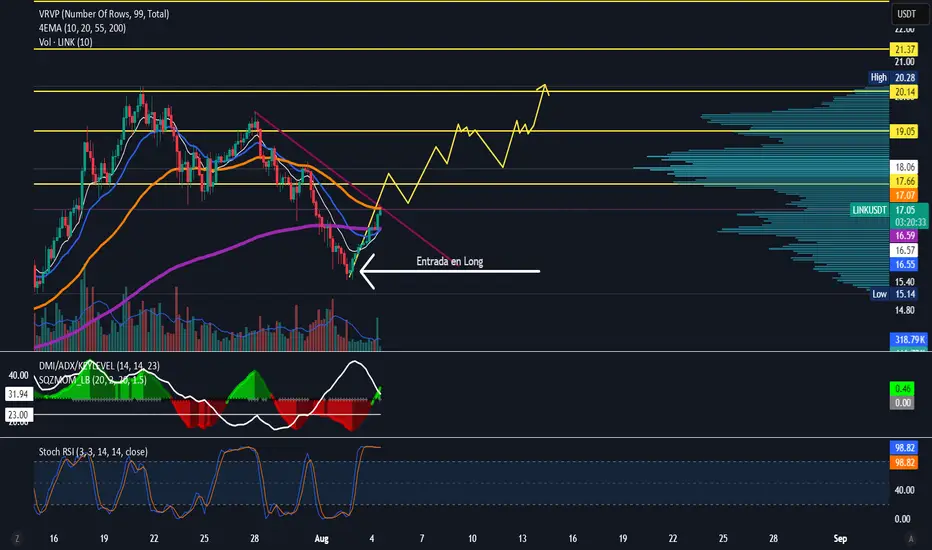
LINK/USDT Bullish Setup – Rebound from Demand Zone Targets ChainLink (LINK) is showing a potential bullish reversal on the 4H timeframe, after defending the key demand zone between $15.60 – $16.20. Buyers stepped in aggressively, and price is now forming higher lows — a good signal of trend shift.
🔍 Technical Breakdown:
Demand Zone (Support): $15.60 – $16.20 (highlighted in orange)
Current Price: $16.65 (bullish structure forming off support)
First Target (TP1): $17.95 (prior resistance / mid-range)
Second Target (TP2): $19.55 – $20.00 (major supply zone)
✅ Bullish Confluences:
Strong bounce off demand zone
Bullish structure forming (higher low + bullish candles)
Volume Profile (LuxAlgo VRVP) confirms demand at this level
Clear imbalance toward $19.55 zone
📌 Trade Plan:
If price continues upward and holds above $16.20:
Entry Zone: $16.50 – $16.80 (current market price)
Stop Loss (SL): Below $15.60 (beneath demand zone)
TP1: $17.95
TP2: $19.55
🧠 Notes:
Break above $17.95 confirms bullish continuation
Take partials around TP1 and trail remaining to TP2
$19.55 zone may trigger short-term pullback due to supply
🟢 Bias: Bullish (as long as $15.60 holds)

Buy Trade Strategy for LINK: Driving Smart Contract ConnectivityDescription:
This trading idea focuses on LINK, the native token of the Chainlink network, a leading decentralized oracle solution that connects smart contracts with real-world data. LINK plays a critical role in enabling secure, reliable, and tamper-proof data feeds for DeFi, NFTs, gaming, and enterprise blockchain applications. As blockchain adoption accelerates, Chainlink’s expanding integrations and partnerships strengthen its position as the go-to oracle provider. The growing demand for accurate off-chain data in on-chain environments continues to support LINK’s long-term value proposition.
That said, the cryptocurrency market is highly volatile and influenced by factors such as regulatory changes, technological developments, and market sentiment. Investors should approach LINK with a clear strategy and strong risk management practices.
Disclaimer:
This trading idea is for educational purposes only and does not constitute financial advice. Cryptocurrencies like LINK carry substantial risks, including the possibility of losing your entire investment. Always perform your own research, assess your financial situation, and consult with a licensed financial advisor before making any investment decision. Past performance is not indicative of future results.

#LINK/USDT targeting 17.77 $ ?#LINK
The price is moving within a descending channel on the 1-hour frame and is expected to break and continue upward.
We have a trend to stabilize above the 100 moving average once again.
We have a downtrend on the RSI indicator that supports the upward break.
We have a support area at the lower boundary of the channel at 15.60, acting as strong support from which the price can rebound.
We have a major support area in green that pushed the price higher at 15.30.
Entry price: 15.84
First target: 16.47
Second target: 17.00
Third target: 17.77
To manage risk, don't forget stop loss and capital management.
When you reach the first target, save some profits and then change the stop order to an entry order.
For inquiries, please comment.
Thank you.

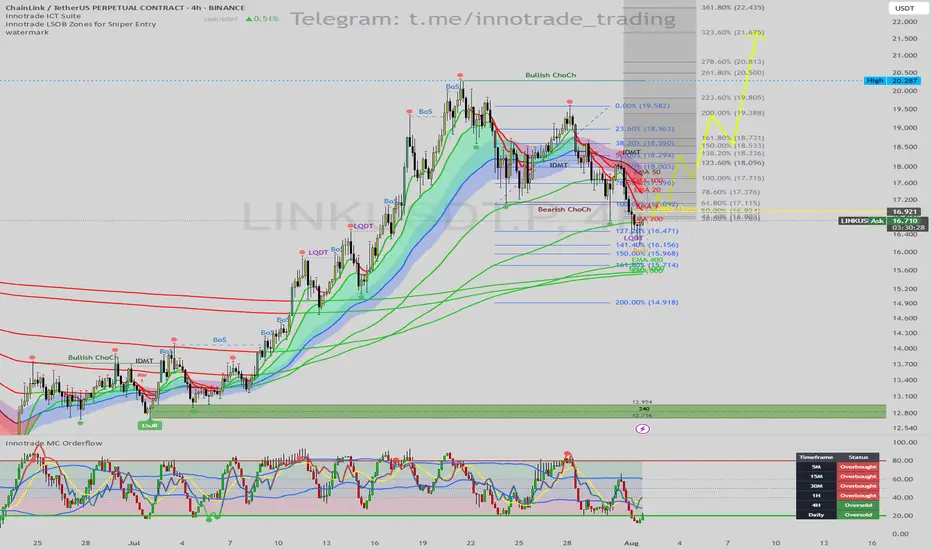
LINK/USDT: A+ Long Setup at Key Support with Daily OversoldHello traders,
I am monitoring a high-probability long setup on LINK/USDT on the 4H timeframe. The chart is presenting a classic reversal scenario where multiple technical factors are aligning perfectly, suggesting the recent corrective move may be over.
1. Trend & Context (The "Why")
After a strong uptrend, LINK experienced a necessary pullback, confirmed by a Bearish Change of Character (ChoCh). The price has now reached a critical zone where we can anticipate a bullish resumption.
Here are the key confluences for this setup:
Major Dynamic Support: The price is finding strong support directly on the EMA 200, a significant long-term moving average that often marks the end of a correction in a larger uptrend.
Price Action Signal (Liquidity Sweep): The most recent candle performed a perfect Liquidity Sweep (LQDT), wicking below the prior low to take out stop losses before quickly reclaiming the level. This is a classic institutional pattern that often precedes a strong move up.
Momentum Confirmation (MC Orderflow): The momentum oscillator provides the final, high-conviction confirmation:
The MC Orderflow is deep in the OVERSOLD territory, indicating that selling pressure is completely exhausted.
CRITICAL MTF CONFLUENCE : The Multi-Timeframe Cycle Table is showing that both the 4H and Daily timeframes are "Oversold". This HTF alignment is extremely powerful and significantly validates the strength of the reversal signal from this support level.
2. Entry, Stop Loss, and Targets (The "How")
The confluence of these signals provides a clear trade plan with an excellent risk-to-reward profile.
Entry: An entry around the current price ($16.70 - $16.90) is optimal, directly at the EMA 200 support.
Stop Loss (SL): $16.25. This places the stop loss safely below the low of the liquidity sweep wick, providing a clear invalidation point for the trade.
Take Profit (TP) Targets:
TP1: $18.20 (Targeting the cluster of short-term EMAs and the recent consolidation zone).
TP2: $19.50 (The next major swing high resistance).
TP3: $20.28 (The major high of the range, a full trend-reversal target).
Conclusion
This trade presents a textbook "A+" setup. The synergy between a key price action pattern (liquidity sweep) at a major technical level (EMA 200), combined with validated momentum exhaustion on both the 4H and Daily timeframes, creates a very high-probability environment for a significant bullish move.
Disclaimer: This is not financial advice. This analysis is for educational purposes only. Always conduct your own research and manage your risk appropriately.
Link targeting 30$In my view after a deeper retracement to 0.618 fibonacci level , about 16.3$, Link bullish trend will resume to target 30.4$

Long trade
📘 Trade Journal Entry
🔹 Pair: LINKUSDT
📅 Date: Friday, 8th August 2025
🕖 Time: 7:30 PM
🗺 Session: NY to Tokyo Session PM
⏱ Timeframe: 15-Minute TF
📈 Direction: Buyside
📊 Trade Details
Parameter Value
Entry Price 16.668
Profit Target 18.229 (+9.37%)
Stop Loss 16.562 (−0.64%)
Risk-Reward 14.73: 1
📌 Technical Context
Entry Zone: The trade was initiated after observing a sell-side liquidity sweep, followed by an internal break of structure (BOS), which supported the shift toward bullish intent. The trade aligns with a Wyckoff-style accumulation schematic, with a Phase C spring-type event visible. We anticipate that Phase D — a trending move within the range — is now underway.

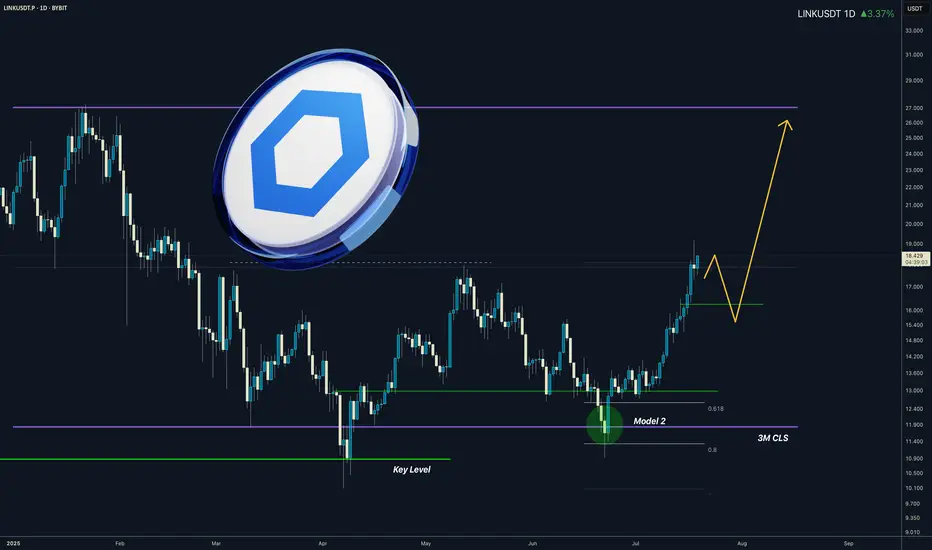
LINK I 3M CLS I Model 2 In the Motion I Target Full CLS rangeYo Market Warriors ⚔️
Fresh Crypto Analysis— if you’ve been riding with me, you already know:
🎯My system is 100% mechanical. No emotions. No trend lines. No subjective guessing. Working all timeframes. Just precision, structure, and sniper entries.
🧠 What’s CLS?
It’s the real smart money. The invisible hand behind $7T/day — banks, algos, central players.
📍Model 1:
HTF bias based on the daily and weekly candles closes,
Wait for CLS candle to be created and manipulated. Switch to correct LTF and spot CIOD. Enter and target 50% of the CLS candle.
For high probability include Dealing Ranges, Weekly Profiles and CLS Timing.
Analysis done on the Tradenation Charts
Disclosure: I am part of Trade Nation's Influencer program and receive a monthly fee for using their TradingView charts in my analysis.
Trading is like a sport. If you consistently practice you can learn it.
“Adapt what is useful. Reject whats useless and add whats is specifically yours.”
David Perk aka Dave FX Hunter
💬 Comment any Coin I ll give you my quick view
Buyer Setup BuildThere is a buyer setup already created. What to wait? Just some pullbacks, take longs, take profits on high demand zones, and wait for another pullback. This month I could wait for looking some new ATH on some criptos, i doubt a lot than link/usdt can reach yours, but nobody knows. In the meant time, keep waiting
LINK - The sleeping Giant ready to wake!Don't forget to add LINK to your watchlist — it's a solid project with long-term investment potential.
The weekly chart shows that LINK is currently retesting the downtrend line it recently broke — a textbook bullish retest.
The lower trendline now acts as a key support level, and as long as price holds above it, the structure remains healthy.
Currently trading around $17.6, the price hasn’t moved significantly yet —
You’ve got:
✅ A strong fundamental project
✅ A bullish technical setup
✅ Large market cap
✅ Still early entry
What more do you need to enter?
Accumulate now... and thank me later.
Best Regards:
Ceciliones🎯

You don't wanna miss LINK again Every sane person knows that LINK is a key project in the crypto industry. Without it, the entire ecosystem literally cannot exist. And its technological value is higher than SOL, XRP, and especially BNB.
However, many often dislike it because of its weak price growth. Well, now the price has started to rise, and it's time to take a closer look at the chart to see what lies ahead:
➡️ LINK is globally in a flag pattern and is now literally stuck in between, trying to find its next direction. This is a 5-year flag, so trust me, when it breaks out in one direction, the movement will be wild.
➡️ During its correction this winter, LINK formed a large GAP at the top at $26.46 - 20.45. And as we know, 99% of GAPs close sooner or later.
Of course, the last growth impulse was also quite ineffective and formed a gap right below us at the levels of $19.93 - 16.44.
➡️ Volume - there is a divergence in purchase volumes, which is certainly confusing. It shows a decline in buyer interest.
➡️ Money Flow - However, there is still harmony in liquidity inflows. This shows that new capital continues to flow into the asset.
📌 Conclusion:
The chart shows controversial trends, which largely indicate local overheating and a possible correction to the inclined support level. And don't forget that a decision on the LINK ETF is imminent. And while the DOGE ETF and other crap may not be approved, such a key project will not be overlooked.

Chainlink Wave Analysis – 7 August 2025- Chainlink reversed from the support area
- Likely to rise to resistance level 19.55
Chainlink cryptocurrency recently reversed from the support area between the support level 15.00 (former resistance from June), lower daily Bollinger Band and the 50% Fibonacci correction of the upward impulse i from June.
The upward reversal from this support area stopped the previous short-term ABC correction ii from last month.
Given the strongly bullish sentiment seen across the cryptocurrency markets, Chainlink cryptocurrency can be expected to rise to the next resistance level 19.55.

LINKUSDT 12H#LINK has broken below the neckline of the double top pattern on the 12H timeframe.
📌 Place your buy orders near the key support levels:
$15.90 – $15.42
If the price reclaims the neckline and breaks above it, the potential upside targets are:
🎯 $18.96
🎯 $20.28
🎯 $21.54
⚠️ As always, use a tight stop-loss and apply proper risk management.

Chainlink (LINKUSDT) has shown strong bullish momentumKey Points
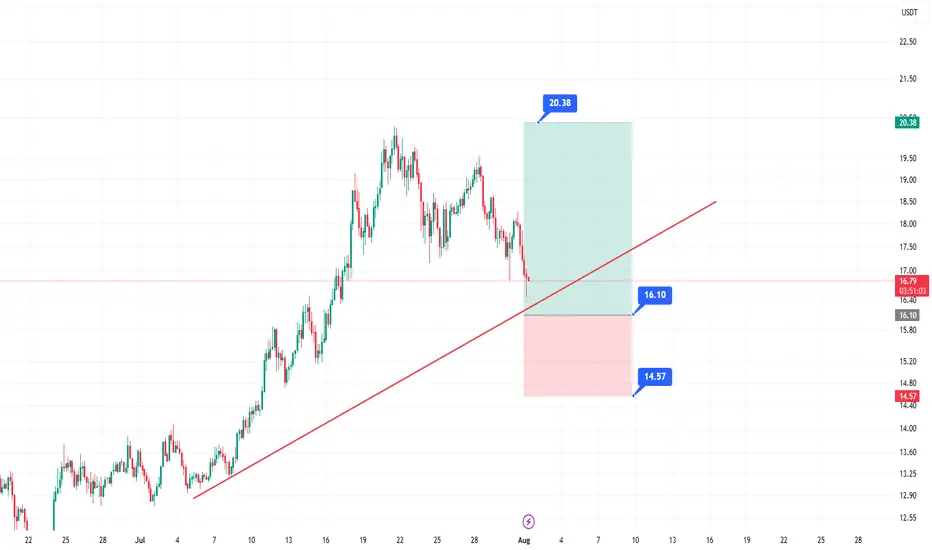
It seems likely that a long entry for LINKUSDT at $15.70–$16.10 using a limit order is a valid strategy, given recent bullish trends and technical support levels.
The take profit at $20.38 and stop loss at $14.57 suggest a favorable risk-reward ratio, but market volatility could affect outcomes.
Research suggests waiting for a pullback to the entry range, as the current price ($16.86) is slightly above it.
Market Context
Chainlink (LINKUSDT) has shown strong bullish momentum, rallying from $11.45 to $19.66 earlier in 2025, and is currently consolidating. The $15.70–$16.10 entry range aligns with key technical levels, including a 0.618 Fibonacci retracement and the 20-period EMA on the 4H chart, making it a potential support zone for a long entry.
Trade Plan
Entry: Use a limit order between $15.70 and $16.10, splitting entries for better average price.
Take Profit: Aim for $20.38, offering a significant upside potential.
Stop Loss: Set at $14.57 to manage risk, ensuring a clear invalidation level.
Risk Management: Risk 1–2% of your account, adjusting position size based on the stop distance.
Considerations
Given the current price is $16.86, you may need to wait for a pullback to enter at the desired range. Monitor Bitcoin’s price action, as it can influence altcoins like LINKUSDT. Always do your own research, as crypto markets are highly volatile.
Survey Note: Detailed Analysis of LINKUSDT Long Entry Strategy
This survey note provides a comprehensive analysis of the proposed LINKUSDT long entry strategy, incorporating your specified parameters (entry at $15.70–$16.10, take profit at $20.38, and stop loss at $14.57) and recent market data as of 09:31 AM +0530 on Friday, August 01, 2025. The goal is to create a detailed trading idea suitable for publishing on TradingView, with technical analysis, risk management, and community engagement considerations.
Market Overview and Recent Price Action
Chainlink (LINKUSDT) has demonstrated significant bullish momentum throughout 2025, breaking out of a multi-month descending channel and rallying from a low of $11.45 to a high of $19.66. As of today, the current price is $16.86 USD, based on the most reliable price data available. This price reflects a pullback from recent highs, suggesting a consolidation phase after a 58% rally, which is typical for healthy trend continuation.
Recent analyses on TradingView and X posts indicate a bullish outlook, with several traders targeting levels above $20, supported by strong fundamentals such as Chainlink’s role as a leading DeFi oracle. For instance, an X post from @cryptoolivee on July 29, 2025, suggested that if $17 holds, targets could reach $22.50–$30.60, while another from @Solfishsoul highlighted a descending wedge breakout with a potential target above $20, backed by RSI crossing 50 and volume spikes.
However, the current price of $16.86 is slightly above your proposed entry range of $15.70–$16.10, which may require waiting for a pullback or adjusting the strategy. Given Bitcoin’s price above $95,000, altcoin strength is supported, but monitor BTC dominance for potential impacts on LINKUSDT.
Technical Analysis
To justify the entry range and targets, let’s break down the technical setup:
Price Action and Structure:
On the 4H and 1D charts, LINKUSDT is forming higher highs and higher lows, confirming a bullish trend. The pullback to $15.70–$16.10 aligns with:
A 0.618 Fibonacci retracement level from the $11.45 low to $19.66 high, a common reversal zone.
A previous resistance-turned-support zone around $16.00, based on historical price action.
The 20-period EMA on the 4H chart, acting as dynamic support, which recent analyses on TradingView confirm as a key level.
Key Levels:
Support Zone: $15.70–$16.10, with stacked confluence from Fib, prior structure, and EMA.
Resistance Targets:
T1: $17.50 (recent consolidation low, +9% from entry).
T2: $19.80 (prior high, +23% from entry).
T3: $21.00 (channel breakout target, +31% from entry).
Your specified take profit at $20.38 fits within this bullish range, offering a significant upside potential.
Invalidation: A 4H close below $15.20 signals a potential trend reversal, but your stop loss at $14.57 provides a wider buffer, which is prudent given crypto volatility.
Indicators:
RSI (4H): Currently at 58, indicating bullish momentum without being overbought, with room for upside before reaching 70.
Volume: Recent breakouts ($15–$17 and $19) showed increasing volume, suggesting strong buying interest. The current pullback shows lower volume, typical of a healthy retracement, as noted in TradingView analyses.
MACD (4H): Bullish crossover intact, with the histogram showing slight weakening but no bearish divergence, supporting the setup.
Market Context and Sentiment:
TradingView’s technical ratings as of today show a neutral signal, but a buy signal for 1 week and a strong buy for 1 month, aligning with the bullish sentiment. Volatility is 3.28% today, with a 24-hour change of -0.11%, -2.70% for 1 week, but +32.31% for 1 month and +32.37% for 1 year, indicating strong longer-term momentum.
X posts, such as one from @Arvintd on July 25, 2025, suggest long entries at $17.150–$17.600 with targets up to $19.650, slightly above your range but supportive of bullish moves. Another from @2gentledude echoed similar levels, using 50x leverage, though caution is advised for such high leverage.
Trade Plan and Execution
Given your parameters, here’s how to structure the trade for TradingView publication:
Setup: Long LINKUSDT with a limit order in the $15.70–$16.10 range.
Entry Zone: Place limit orders between $15.70 and $16.10, splitting entries for better average price to manage slippage.
Take Profit Targets:
Your specified TP at $20.38 can be the primary target, offering a significant upside. For scaling, consider:
T1: $17.50 (50% position, R:R 2.5:1).
T2: $19.80 (30% position, R:R 5:1).
T3: $21.00 (20% position, R:R 6.5:1), given the bullish targets in analyses.
Stop Loss: Set at $14.57, as specified, which is below the $15.20 invalidation level, providing a wider buffer for volatility.
Risk Management:
Risk 1–2% of your account per trade, adjusting position size based on the stop distance (from $15.90 average entry to $14.57 SL, ~8.5% risk, so size accordingly).
Use spot or low leverage (3–5x) to manage risk, as futures trading amplifies losses, especially given recent X posts suggesting 50x leverage, which is high risk.
Trade Duration: Expected 3–10 days, depending on momentum and BTC price action.
Execution Notes:
Wait for price to enter the $15.70–$16.10 zone and show bullish confirmation, such as a 1H bullish candle, RSI bounce, or volume increase, to ensure entry at support.
Avoid chasing if price breaks above $16.50 without testing the entry zone, as it may indicate a stronger upward move bypassing your range.
Risk Assessment and Considerations
Crypto markets are highly volatile, and several factors could impact this setup:
A Bitcoin drop could drag LINK below $15.20, potentially hitting your SL at $14.57. Monitor BTC dominance and LINK/BTC pair for correlations.
False breakouts are possible; if $15.70 fails to hold, price may test lower supports like $14.00–$14.20, as noted in some TradingView analyses.
Given the current price of $16.86, you may need to wait for a pullback, which could take time or not occur, adding uncertainty. Adjust expectations if the market continues upward.
Community Engagement and Publishing Notes
To maximize engagement on TradingView:
Chart Setup: Attach a 4H or 1D chart with:
Marked entry zone ($15.70–$16.10).
Fibonacci retracement levels (0.618 at ~$16.00).
20 EMA on 4H.
Support/resistance zones ($17.50, $19.80, $21.00).
Stop loss level ($14.57, as specified).
Tags: #LINKUSDT #Chainlink #CryptoTrading #BullishSetup #TechnicalAnalysis #Altcoins
Visibility: Set to public for maximum reach.
Engagement: Encourage comments, such as “What’s your take on LINKUSDT? Are you bullish or waiting for a deeper dip? Drop a comment below, and let’s discuss!” and respond to feedback to build credibility.
Summary Table of Key Levels and Targets
Level/Type
Price (USD)
Description
Entry Range
15.70–16.10
Limit order zone, Fib and EMA support
Take Profit (TP)
20.38
Primary target, aligns with bullish targets
Stop Loss (SL)
14.57
Wide buffer below invalidation at $15.20
Support Levels
14.00–14.20
Potential lower test if entry fails
Resistance Targets
17.50, 19.80, 21.00
Scaling targets for partial profits
This table summarizes the critical levels for your trade, ensuring clarity for TradingView readers.
Disclaimer and Final Notes
Trading cryptocurrencies involves high risk, and you may lose more than your initial capital. Always use proper risk management and consult your financial advisor before trading. This idea is based on available data and analyses but is not financial advice—do your own research (DYOR).
Given the current price of $16.86, this setup may require patience for a pullback, but the technical confluence and bullish sentiment support its validity. Adjust as needed based on market developments.
Key Citations
Chainlink/Tether Price Chart Analysis
Recent LINKUSDT Trade Ideas
Chainlink Price and Chart Data
LINKUSDT Trading Idea from Arvintd
LINKUSDT Monthly Analysis from cryptoolivee
LINKUSDT Breakout Analysis from Solfishsoul
LINKUSDT Long Idea from 2gentledude
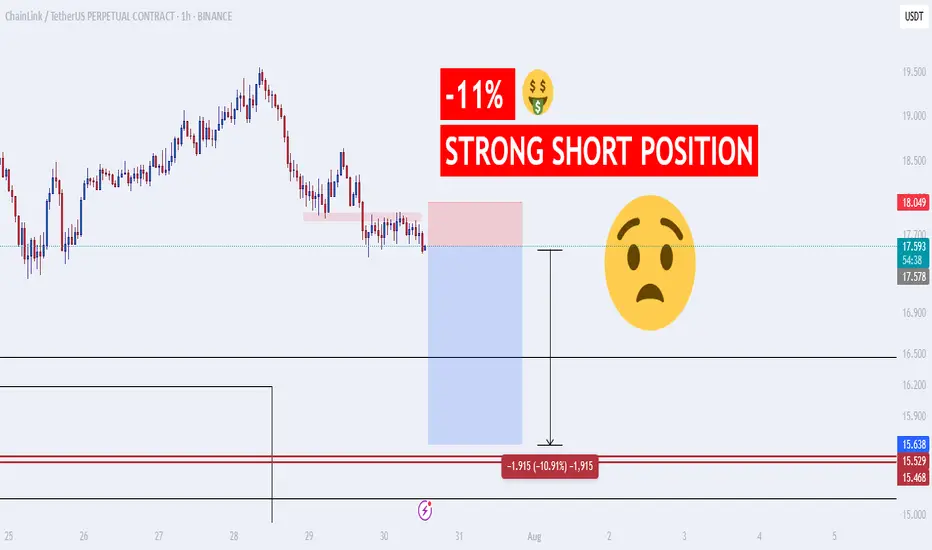
OMG!!! Srtong Short Position!! -10%The price of BIST:LINK is expected to drop by 10% soon. If you enter a short position with 10x leverage, you can potentially make a 100% profit and double your capital! This is an excellent opportunity. Strong sell signal: just take a look at the chart.
Chainlink (LINK): Potential Bounce Incoming | Eyes on Neckline!Chainlink is in an accumulation zone currently bouncing from that neckline zone (which has aligned with 100 EMA).
We are looking for proper bounce or buyside signs here, which would give us a good opportunity for a potential buy entry here
Swallow Academy
