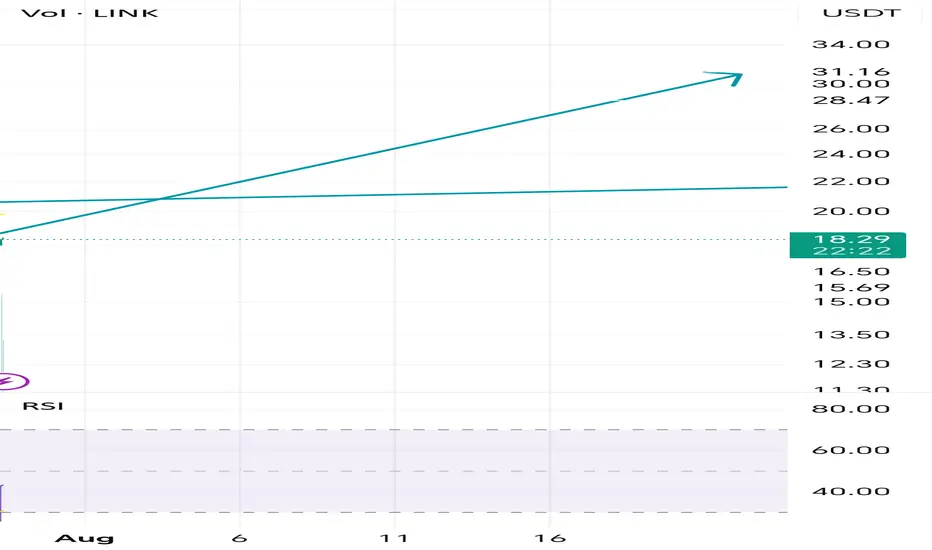
LINK/USDT, 1H chart, Futures - Bullish projection.based on 1H chart, we have a confirmed bullish divergence, this divergence is supported by potential bullish divergence in formation for 4 chart
H, so it could boost the movement with much more upward probabilities.
LINKUSDT.3L trade ideas

LINK's Technical Signals Point to a 50% Rally by Years-EndLINK is trading at approximately $19.26. The price has shown significant volatility and upward momentum over the past few months, moving from around $10-11 in early 2025 to the current levels near $19, representing an impressive 80-90% increase.
Technical Indicator Analysis
RSI (Relative Strength Index)
The daily RSI is currently at 61.60, which is in bullish territory but not yet overbought
The 4-hour RSI is showing similar strength at 61.60
This indicates robust momentum without reaching extreme levels that would trigger immediate profit-taking
Historical data shows LINK can sustain RSI readings in the 60-70 range during strong uptrends
Price Action Patterns
LINK has formed a series of higher highs and higher lows since May 2025
The price recently consolidated in the $17-19 range before showing signs of continuation
There was a significant price surge from $13-14 levels to above $19 in mid-July, indicating strong buying pressure
The consolidation after rapid gains suggests healthy market behaviour rather than exhaustion
Volume Analysis
Volume has been increasing during upward price movements
Notable volume spikes occurred during the breakout from $15 to $17 and again during the move above $19
This suggests genuine buying interest rather than a low-volume pump
The Volume-Weighted Average Price (VWAP) continues to slope upward, confirming the strength of the trend
Support and Resistance Levels
Strong support has formed around $17.50-18.00
Previous resistance around $19.00 is now being tested as support
The next major resistance appears to be in the $20-21 range based on previous price action
After that, there's relatively little historical resistance until the $25 level
Fibonacci Projections
Using the recent swing low of approximately $11.45 (May 2025) to the recent high of $19.66:
The 161.8% extension projects a target of approximately $24.70
The 200% extension suggests a move toward $28.00
These Fibonacci levels often serve as magnets for price during strong trend movements
LINK Price Projection
Based on the technical indicators analysed:
Short-term (August-September 2025):
LINK appears poised to break through the $20 psychological barrier
Initial target around $22-23 as the next resistance level
Support should hold around $17.50-18.00 on any pullbacks
The clean break above previous resistance at $18.50-19.00 suggests momentum remains strong
Medium-term (October-November 2025):
If the current trend structure remains intact
LINK could target the $24-25 range, aligning with the 161.8% Fibonacci extension
Previous all-time highs near $30 could come into play by year-end
The steady stair-stepping pattern of rallies followed by consolidation suggests this move would be sustainable
Key Factors to Watch:
Volume on breakouts above $20 and $25
RSI readings for signs of exhaustion or continued strength
Development updates and adoption news specific to Chain-link
Maintenance of the higher lows pattern on any pullbacks
Conclusion
The technical picture for LINK appears bullish, with multiple indicators suggesting continued upward momentum. The price has established a strong uptrend with healthy consolidation periods. The recent price action shows accumulation rather than distribution, with higher lows forming during consolidation phases.
The most likely scenario based on current data suggests LINK could reach the $24-25 range in the next 2-3 months, with potential for movement toward $28-30 by the end of 2025, representing a 30-55% increase from current levels. However, investors should monitor key support levels around $17.50-18.00 for any signs of trend reversal.
The clean chart structure, steady volume profile, and measured RSI readings all point to a continuation of the current uptrend, making LINK's technical outlook decidedly positive for the remainder of 2025.
Link pump today at least $18.78Am taking this #Link long. Anticipate tp to hit today if goes according to plan.
Weekly bullish
Daily bullish
4hr bearish
1hr bullish
I think the market will soon attempt to flip back bullish on the 4hr tf. Market is making...(Further breakdown on my X page with more charts)

LinkOn the higher TF Link is breaking out from its structure, my first target is 21.5
2nd target 28
3rd 30
Good luck
MY idea
Chainlink (LINK): Looking For Target of 200EMA (Daily)Chainlink has done very well, and we have also opened one long position near the breakout area at $14. Now we are looking for the price to have a proper retest after what we expect to see some downward movement so eyes on the daily 200EMA line for now!
Swallow Academy

Smart Robbery Plan: LINK/USDT Long Setup | Swing/Day Trade Idea🚨CHAINLINK HEIST PLAN 🚨 | LINK/USDT Market Robbery (Thief Trader Style) 💰🔐
🌍 Hola! Bonjour! Hallo! Marhaba! What’s up, Money Makers & Market Robbers?! 🕶️💵
Get ready to raid the LINK/USDT vault with Thief Trader’s high-precision strategy based on 🔥 Technical & Fundamental fusion 🔥.
This is not your regular setup. This is a robbery roadmap. Designed for swing & day traders, and spiced with smart DCA entries, risk control, and a bold vision. Let's get into the game plan before the market alarms go off! 🚓📉📈
🎯 Master Plan – LINK/USDT | Bullish Setup
Entry:
📌 “The vault is open – grab the loot!”
Start entering long anywhere within the nearest price pullback zone. Use 15m to 30m TFs for sniper-style limit entries.
🛠️ Deploy DCA-style multiple limit orders (layered strategy), preferably around recent swing lows or major liquidity zones.
Stop Loss:
🔐 Place SL just below the 4H swing low wick (Currently at $16.50), adjusting for your risk, lot size, and how many limit orders you're stacking.
Take Profit:
🎯 Main TP target: $21.50
⛔ Or bail early if momentum weakens. Your profit, your decision.
⚡️Scalper’s Memo:
Only scalp on the bullish side – stay with the smart money.
Have deep pockets? Jump in now.
On a budget? Join swing traders and follow the full heist plan.
📉 Use trailing SL to secure profits during volatile rallies.
🔍 Fundamental & Sentiment Snapshot:
LINK is gaining bullish traction due to a combo of strong sentiment, favorable macro outlook, and on-chain flows aligning.
📊 Keep eyes on COT reports, intermarket data, and liquidity metrics.
🧠 Sentiment leans bullish while late bears are trapped in the supply zones above.
🛑 Risk & News Management Alert:
🚨 News releases can spike volatility and mess with clean entries.
📵 Avoid placing trades during high-impact events.
📍 Use trailing stop-loss to protect your running profits and preserve capital.
💖Support the Plan, Join the Heist:
Love the trade idea? 💥Hit the BOOST💥 button and show some love to the strategy that lets traders "rob the market" with confidence.
Every like helps build the strongest heist crew on TradingView.
✅ Stay sharp. Stay patient. Stay profitable.
👤 Thief Trader signing out… until the next raid. 🐱👤💰🚀
#LINK #LINKUSDT #CryptoTrading #ThiefTrader #SwingTrade #DayTrade #DCA #BullishSetup #TradingPlan #TA #RobTheMarket #ChainlinkHeist #SmartMoneyMoves

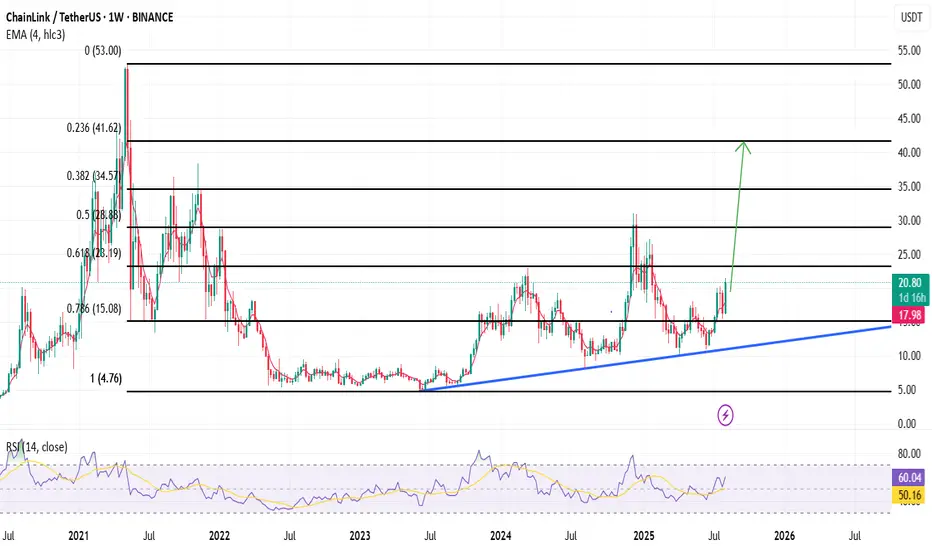
Chainlink UpdateLooking at long term chart in my opinion chainlink will grow to 0.236 fibonacci level @41.6$, I don't think it can go beyond that target in this bullish cycle.
a great bullish engulfing candlei see a big bullish engulfing candle in weekly time frame we ready for big bullish next target is 240

LINKUSD – Bullish Impulse Toward D-Point Target
LINKUSDT:
Title: LINKUSD – Bullish Impulse Toward D-Point Target
Price action has completed a corrective ABC structure, finding strong support at point C. The current breakout above mid-structure resistance confirms bullish momentum, aiming toward the D-point completion. Risk is managed below the breakout zone, with potential for trend continuation if price sustains above local support.
Risk Management Notes:
– Entry aligned with breakout confirmation
– Stop-loss below structural support (C-area)
– Take-profit near projected D-point completion


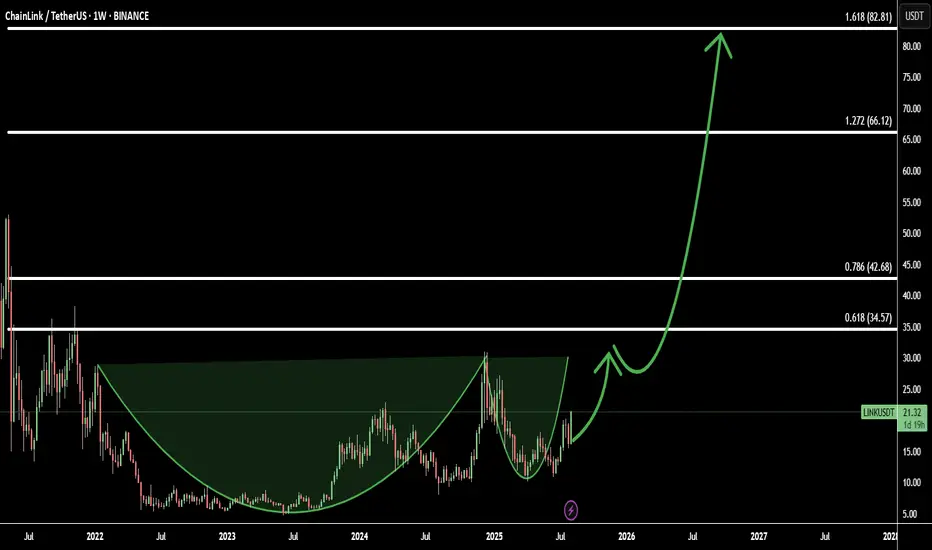
LINK/USDT – Cup & Handle Breakout: 4 Fibonacci Targets AheadGood luck to everyone who bought the dip — now Chainlink (LINK/USDT) is offering another buy opportunity before the big move.
On the chart, LINK has formed a cup & handle pattern — a strong bullish continuation setup that often marks the start of a major rally. This is the beginning of the movement, and price action is aligning perfectly with technical targets.
Using Fibonacci extensions, here are the 4 upside targets:
Target 1: 0.618 Fib – 34.57 - initial breakout confirmation
Target 2: 0.786 Fib – 42.68 - momentum acceleration zone
Target 3: 1.272 Fib – 66.12 - extended bullish target
Target 4: 1.618 Fib – 82.81 - full potential of the pattern
With momentum building and a clean breakout structure, LINK is ready to fly toward these targets.
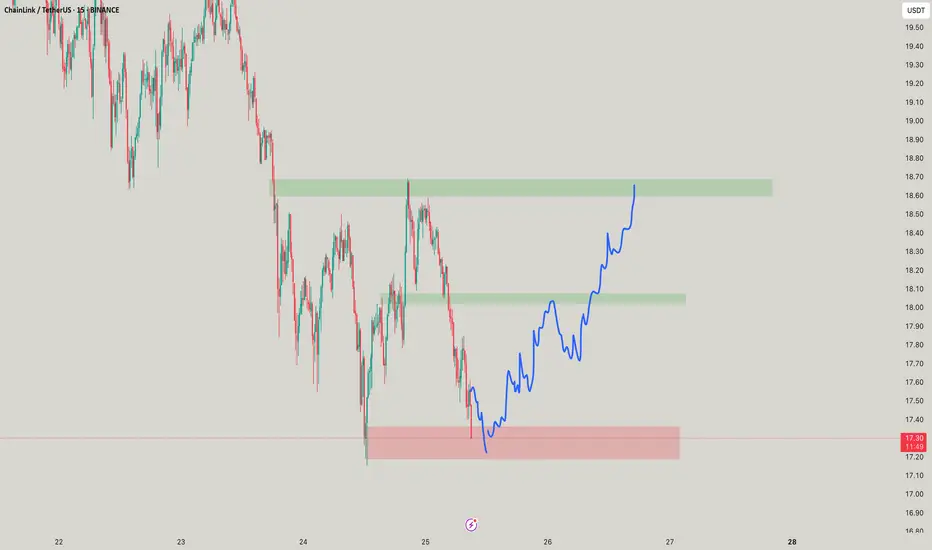
SHORT LINKHere’s a detailed trading analysis for your SHORT setup on LINK/USDT based on the chart:
🔍 Chart Context
Pair: ChainLink / USDT
Exchange: Binance
Timeframes: 4H (left) and 15m (right)
Current Price: ~$18.05
Short Bias: Bearish reaction expected from supply zone
🔲 Key Zones & Levels
🔼 Resistance / Supply Zone
$18.11 - $18.50 (highlighted in purple box)
Price reacted sharply on first touch → signs of sell pressure.
Confluence:
Previous highs
Psychological resistance near $18.50
🔽 Support / Target Zone
$17.05 - $16.50 (marked by orange and green box levels)
Prior consolidation and demand area
First strong reaction expected around $17.10–$17.20
🧭 Trade Idea (SHORT)
🎯 Entry
Area: $18.05–$18.50 (preferably near the top of the purple box)
Confirmation: 15m or 1h bearish engulfing or liquidity sweep + reversal
⛔️ Stop Loss
Above $18.60
Reason: Above the wick and supply zone, avoiding stop hunt
📉 Targets
TP1: $17.50 (edge of green box, early profits)
TP2: $17.00 (orange support line)
TP3: $16.50–$16.00 (final target on full breakdown)
🔧 Technical Indicators
RSI (Relative Strength Index)
4H RSI: ~69.74 → nearly overbought
15m RSI: ~66.90 → potential bearish divergence
Conclusion: Momentum slowing, ripe for pullback
Volume
Spike on breakout to $18+ zone → Possible buy climax
Declining after → suggests distribution phase
🧠 Probability Triggers
✅ High Confluence for SHORT
Strong supply zone
Overbought RSI
High volume spike + exhaustion
Clear FVG (Fair Value Gap) and imbalance below
❌ Short Invalidated If
Break & close above $18.60 with volume
Consolidation above $18.50
📝 Summary
Criteria Details
Bias SHORT
Entry Zone $18.05 – $18.50
Stop Loss Above $18.60
Target Range $17.50 → $17.00 → $16.50
Risk/Reward Approx. 1:2.5 to 1:3.5
Confidence ✅ High (Supply zone + RSI + Volume confluence)

Chainlink (LINK/USDT) from 1D interval📈 Trend and Market Structure
Current trend: Upward (higher lows and highs)
The price is moving within an ascending price channel, marked by two black trend lines.
The recent rebound occurred from support around 14.83 USDT, which coincides with the lower boundary of the channel.
🔍 Key Levels
✅ Resistance (green horizontal lines)
18.98 USDT – local high
21.16 USDT – main resistance, possible target after breaking $19
18.27 USDT – current local resistance zone, currently being tested
17.62 USDT – mid-range resistance
🛑 Support (red horizontal lines)
15.97 USDT – first local support
14.83 USDT – important support (price reaction, trend confirmation)
13.30–13.50 USDT – key demand zone
12.50 USDT – lower historical support
📊 Indicators
🔄 Stochastic RSI
%K and %D lines cross from below → buy signal
Currently emerging from oversold levels (< 20), which could indicate a continuation Growth
📉 MACD
The histogram is decreasing, but the rate of decline is slowing.
Possible buy signal if the MACD line crosses the signal line from below.
🔊 Volume
Increasing volume during gains, lower volume during corrections – confirms bullish strength.
The recent decrease in volume may indicate consolidation or preparation for the next move.
📌 Scenarios
🟢 Bullish Scenario:
Uptrend maintained within the channel.
Breakout above 18.27 and 18.98 → possible rally to 21.16.
Confirmation by MACD/Stoch RSI.
🔴 Bearish Scenario:
Break of support at 15.97 and the trend line → possible decline to 14.83 or lower (13.30).
MACD may continue to decline if a strong rebound is not achieved.
🧠 Summary
Trend: Bullish
Price is currently testing resistance at 18.27.
Key support levels to watch: 15.97 and 14.83.
Indicators are providing potential buy signals, but confirmation will be needed on higher time frames or on stronger volume.

LINK/USDT 15M SETUP.LINK/USDT 15m Setup 🔥
Price confirmed a bullish shift with a clear ➜ ChoCH.
Now retracing and heading toward a Hidden Demand Zone, with Sell-Side Liquidity (SSL) resting above it.
📍 Expecting price to sweep SSL and tap the zone before a potential bullish reversal.
Perfect SMC setup — wait for reaction and confirmation! 📈


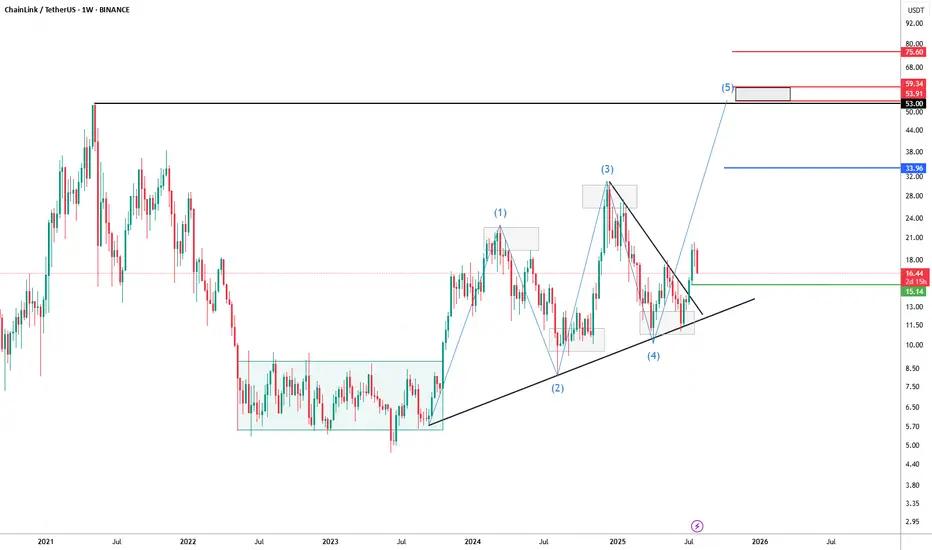
LINK/USDT Weekly Chart – Wave 5 in Play?Chainlink has been showing a textbook technical setup. After spending most of 2023 in a prolonged accumulation phase (highlighted in the range-bound consolidation box), price action broke out and has since been respecting a clear harmonic and Elliott Wave structure.
We’ve now likely completed waves (1) through (4), with a clean breakout from the wedge suggesting the beginning of the final 5th impulsive wave. The projected target zone for wave (5) sits between $53 and $59, aligning with key historical resistance and Fibonacci extension levels.
🔹 Support Zone: $15.14 — key structure and prior breakout level.
🔹 Mid-Level Target: $33.96 — potential resistance and consolidation area.
🔹 Final Target Area: $53.00–$59.34 — Wave 5 objective.
🔹 Stretch Target: $75.60 — if momentum exceeds expectations.
The ascending trendline from mid-2022 continues to act as dynamic support, helping guide this move. As long as the structure holds, the bullish thesis remains intact.
📈 Watching for confirmation of continuation and volume follow-through as we head into Q4.
#LINK #Chainlink #LINKUSDT #CryptoTA #ElliottWave #Harmonics #Altcoins
$Link/USDTLINK has taken on a strong upward trend on the daily timeframe and has the potential for solid growth. The EMA cross also confirms this trend. You can either wait for a pullback or consider entering a partial position at the current level

LINK Swing Trade – Watching for a PullbackLINK has rallied 58% since June 24th and is now consolidating after making a higher high. Price action is facing resistance and looks overheated, so a pullback toward support could offer a fresh long entry.
📌 Trade Plan:
• Entry Zone: $15.00 – $16.00 (on pullback)
• Take Profit Levels:
o 🥇 $20
o 🥈 $25
o 🥉 $30
• Stop Loss: Close below $13

link buy midterm"🌟 Welcome to Golden Candle! 🌟
We're a team of 📈 passionate traders 📉 who love sharing our 🔍 technical analysis insights 🔎 with the TradingView community. 🌎
Our goal is to provide 💡 valuable perspectives 💡 on market trends and patterns, but 🚫 please note that our analyses are not intended as buy or sell recommendations. 🚫
Instead, they reflect our own 💭 personal attitudes and thoughts. 💭
Follow along and 📚 learn 📚 from our analyses! 📊💡"

LINK your Idea! Its time!Buying at the right time is the best thing you can do and selling at the right time too! aint it?
Link / UsdtBINANCE:LINKUSDT
### 📊 **Chart Overview – LINKUSDT (4H):**
* **Current Price:** \$17.65
* **Recent Trend:** Pullback from the \$20.00 resistance zone.
* **Key Support Zones:**
* Immediate: **\$17.00 – \$17.20** (gray demand zone).
* Stronger: **\$14.00 – \$14.20**.
* **Resistance:** \$20.00 psychological level.
---
### 🔍 **Technical Breakdown:**
1. **Trendline Interaction:**
* Price is testing the **ascending red trendline**, which could act as dynamic support.
* A break below could push LINK toward **\$17.18 or even \$14.16** for a deeper correction.
2. **Bullish Scenario:**
* If the \$17.00 zone holds, LINK could bounce and aim for **\$18.50 – \$19.80** in the short term.
3. **Bearish Scenario:**
* A decisive break below \$17.00 may trigger a larger move down to the **\$14.00 support zone**, offering better accumulation levels.
---
### 📌 **Summary:**
LINK is at a **critical decision point** — watch the \$17.00 support zone and the trendline closely for direction confirmation.
---
⚠️ **Disclaimer:**
*This analysis is for informational and educational purposes only. It is not financial advice. Always DYOR and manage your risk before trading.*

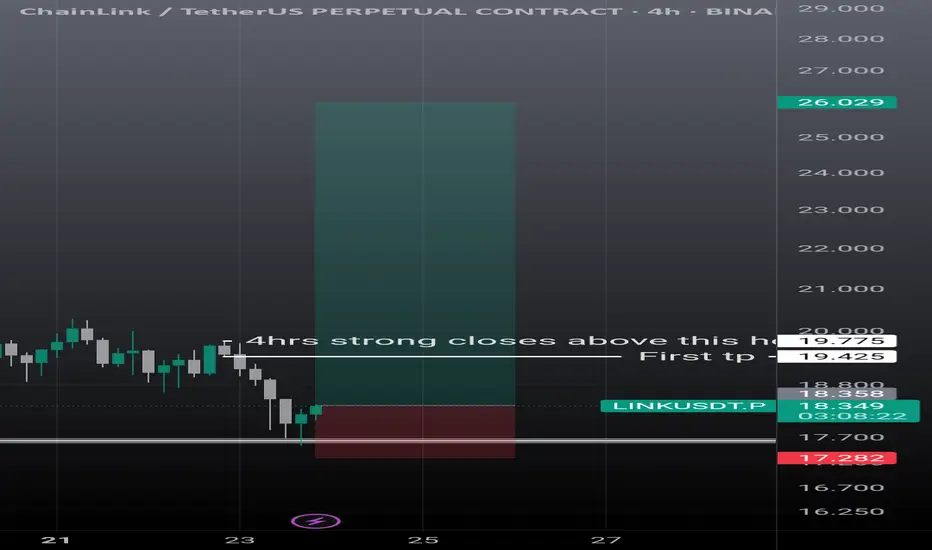
Linkusdt scalp n swing setupLink showing some strong momentum. On 4hrs it can go easily 19.30, then if it breaks strong and closes above the mentioned candle it's next stop is 26$. Must use sl as it can take further correction is it failed to break the mentioned level.
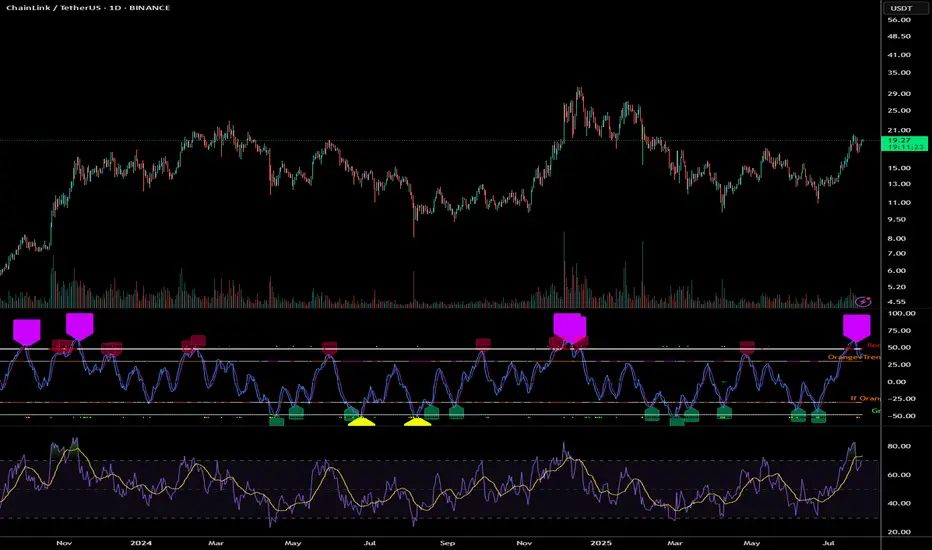
Chainlink (LINK) Trapped Between $18–$20: Explosion Soon?Chainlink (LINK) has been in a strong uptrend for most of July, rallying from under $13 to a recent high of $20.28. This level acted as a clear resistance where a "Sell" signal has been triggered, suggesting a temporary exhaustion of bullish momentum. After this peak, price has pulled back slightly and is now trading near $19.08, hovering between key levels — with $20.28 acting as resistance and $17.98 as nearby support. This positioning confirms that LINK is currently rangebound and consolidating.
Structurally, the price made a series of higher highs and higher lows, with a steep bullish leg between July 14 and July 21. However, recent candles show signs of hesitation. There's less conviction in the current move, indicating that traders are likely waiting for either a breakout above resistance or a breakdown below support to commit to the next move.
The range between $17.98 and $20.28 is now the battlefield. A clean break above $20.28 would signal bullish continuation, with the next logical upside target being around $22 or higher. But if price fails to hold $17.98, it may retrace deeper — first toward $15.66 (the breakout base), and then possibly down to $14.08 or $13.39 where previous accumulation occurred.
Volume appears to have faded slightly during the recent leg up, which adds weight to the idea that LINK needs a consolidation phase before resuming any meaningful trend. There's also a previous "Buy" signal near $15.66 that aligns with the last breakout zone, making this a key level to watch if bears regain short-term control.
Right now, it's a no-trade zone unless the market shows clear direction. Traders with a neutral stance should wait for confirmation — either a strong breakout above $20.28 with a decisive candle and follow-through, or a breakdown below $17.98 which opens up downside opportunity. Until then, LINK is best treated as being in a mid-cycle pause, building up energy for its next major move.
