$LINKUSDT 3x TA (Already moving entered 23/11/2024) JOSE0033 Vol Break out
Weekly Chart
Fib Levels
Cleared all daily EMAs
LINKUSDT.P trade ideas

Is LINKUSDT About to Trap Beginners Before a Big Move?Yello, Paradisers! Is LINKUSDT setting up a trap for beginner traders before making a strong reversal? Let's break down what we're seeing right now.
💎Currently, LINKUSDT is respecting the supportive trendline, but this setup might be a trap for those blindly buying in. There’s a high likelihood that the market will first liquidate traders placing orders along this trendline before making a more meaningful bounce from the actual support zone below.
💎For confirmation, we need to see a shift in market structure, specifically a bullish I-CHoCH (Internal Change of Character) from the support area. Other bullish reversal patterns, like a W pattern or an Inverse Head and Shoulders, would also validate a potential bounce from this zone.
💎If LINKUSDT falls further, we'll look to the strong demand zone below for a high-probability setup. This zone remains unmitigated, meaning it hasn’t been tested yet, increasing the chances of a bullish reaction. However, if the price breaks down and closes below this demand zone, our bullish idea will be invalidated.
💎But here's the twist: should LINKUSDT rise back above this zone after a breakdown and then show bullish signals, it would actually strengthen the bullish outlook even more.
Stay sharp, Paradisers, and remember—patience is key when waiting for the best setups. 🎖
MyCryptoParadise
iFeel the success🌴

LINK is accumulating between two monthly key zones & also below 💰 #LINK is accumulating between two monthly key zones & also below the descending resistance👀
BIST:LINK Imo it's great levels still for to accumulate some more BIST:LINK 🤝
Link Marines it's time to step out of the shadow🚀🫡
🎯Mid-Term Target: 19.69$
🎯Mid-Term Target: 27.55$
🎯Long-Term Target: 35.10$
🎯Long-Term Target: 65.70$
🎯Long-Term Target: 82.40$

LINK Long Spot Trade (Trading at Support)Market Context:
LINK is currently oversold on the 4-hour timeframe and trading in a major area of support, offering a strong opportunity for a long position with a favorable risk-to-reward ratio.
Trade Setup:
Entry Zone: $13.75 - $14.00
Take Profit Targets:
First target: $18.00 - $19.00
Second target: $21.00 - $22.00
Stop Loss: Just below $13.00
This trade capitalizes on the oversold conditions and support alignment, with potential for a strong rebound toward the profit targets.

Shall we have a look on LinkusdtWe can see that it is at 50% of the last low in Aug last year
And now he made up channel for the last downtrend in Mar 2024 and broke it up
So we can enter or add more to our wallet as long as the SL still near to the entrance
Our Goals are represented by red flags so let’s wait and see

3 Crypto OGs to watch this month...Since you enjoyed my previous post about 3 altcoins to watch this weekend...
Here's an interesting one about OGs:
BINANCE:LINKUSDT
LINK broke the structure and $15 round number. As it retests the structure, I will be looking for trend-following longs and target the $20 round number.
BINANCE:DOTUSDT
DOT broke the structure and $5 round number. As it retests the structure, I will be looking for trend-following longs and target the $10 round number.
BINANCE:HBARUSDT
HBAR broke the structure and $0.05 round number. As it retests the structure, I will be looking for trend-following longs and target the $0.15 round number.
Which altcoins would you like me to cover next?
All Strategies Are Good; If Managed Properly!
~Rich

Long LINK1. we have a channel where we'll probably have a fakeout to get the longs SL's
2.on breakout from the channel we'll get a lot of shorts . The price can reverse from there to get the SL's from the new shorts.


ChainLink (LINK/USDT)The chart for ChainLink (LINK/USDT) suggests a breakout from a descending wedge pattern, signaling bullish potential.
Key Levels:
Support Zone: $12.87–$13.50 (retest area).
Stop Loss: Below $8.70 to manage risk.
Target 1 (T1): $20.02
Target 2 (T2): $26.21
Target 3 (T3): $32.40
Recommendations:
Entry Point: Consider buying on a retest near $12.87 if support holds.
Risk Management: Place a stop-loss below $8.70.
Outlook: A confirmed breakout and volume increase could drive prices to higher targets, with $32.40 as the long-term goal.

Chain Link BullishBased on the previous analysis, we were waiting for the coin to break out of the ranging market so that we can have a good entry position.
I do anticipate that the price will continue with the bullish momentum, considering that it has retested the upper trendline.
My entry position will be at 15.00, SL at 12 and target at 22

Chainlink, LINK, Golden pocket sets up 7x, $125, Target 2: $500I've been pretty cautious about projecting higher than the -0.236 algo target this time around but somehow 7x doesn't feel like enough for link... so I've added the second target. I really like this chart. looks very nice.
solid accumulation just above the 0.618, tested and rejected at the bear fib pocket, with a higher low put in at the next golden pocket. seems ready to try again. It also looks like a big cup and handle that gives the same target as the 1st algo... so maybe that is all it gets. even still, 700% for a coin this large and this solid is pretty nice. we get spoilt in crypto don't we?
See linked BTC chart for why my charts are so bull.
The Trade:
Preferred Entry: $8.71
Ape Entry: $14.30
Stop: $9.80 / $7.90
Resistance: $21 - order block + bear golden pocket.
Target 1: $125
Target 2: $500
D.Y.O.R. DO NOT BLINDLY TAKE THESE TRADES.
Never Trust. Verify. PLEASE DO YOUR OWN ANALYSIS.
This is not financial advice. These are just my observations.
Technical Analysis is not about being right, it's about increasing your odds.
Be prepared to be wrong. Risk management is key. Capital preservation above all else.

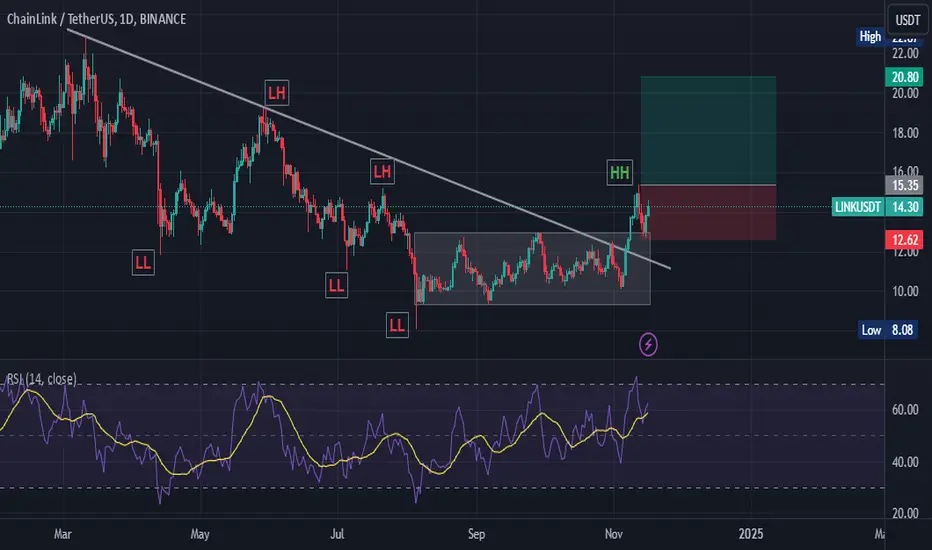
LINK Breakout: First Higher High After ConsolidationLINK has successfully broken out after a period of consolidation and achieved its first higher high. This movement signals potential for continued bullish momentum.
ChainLink Pattern FormationThis coin has been a rising flag for the past few weeks, and I do anticipate that the coin might continue with the bullish momentum considering that it broke out of the structure.
Currently, it is retesting the upper trendline and we have to wait for an entry position. I anticipate that the price might retest the previous fib level based on the ATL and ATH.
An analysis using the lower time frame will follow when we enter the trade.

LINK SWING LONG OPPORTUNITY - ALTSEASON - Altcoin MarketLINK is one of the key blue-chip assets in the crypto market. It is a well-established and reliable project compared to many newer networks and assets, which is why I prefer trading LINK.
Technical Analysis:
The price reached the monthly demand during the August 4th dump, got rejected, and began climbing. Following this, it broke the daily and weekly bearish structure, shifting into bullish momentum. Finally, the price broke the bearish trendline responsible for the downtrend since March 2024.
The price now appears to be retracing into the weekly demand and potentially retesting the flipped bearish trendline. The weekly demand also aligns with the optimal trade entry (OTE) zone, adding extra confirmation for me.
I will look for LTF confirmations to initiate a trade within the marked entry zone.
SL: $9.2
TP1: $19.2
TP2: $22.8

LINK Targets 75% Gain – Can It Hold Support?This chart shows that ChainLink (LINK) might be shifting from a downtrend to an uptrend. The price recently broke above a red descending trend line that had been holding it back for months, which could signal a positive change. LINK is now trading above a strong support zone in Green between $12.52 and $13.03, which suggests that buyers are stepping in to hold the price up. This support level is important; if LINK can stay above it, there’s a chance it could rise to higher levels, starting with the first resistance level around $15.21.
If LINK continues its upward movement, it could reach resistance levels at $17.28, $19.23, and even as high as $22.87, which is the chart’s potential target. This target would mean a 75% gain from the current price if the uptrend holds. However, if the price drops below $12.52, it may retest lower levels, and the bullish outlook would be at risk. Overall, LINK shows signs of strength, but it needs to stay above support to keep the upward momentum going.

LINK UP!Broken out of mid-term daily downtrend since Mar this year. Currently re-testing.
I think we've seen the bottom. Either we bounce off here around $12.70 mark or we break down further and bounce off around $11.43 which is the re-test of a trendline.
Long term bag here so we'll let this run for a while beyond 2021 high.
Sell half at $52.50 then let rest run.
GLTAH!

LinkusdtHi guys
Do you think we should wait for the $10.6 support area to be consumed and the upward trend line to break down?
Or considering maintaining the upward trend line, provided the previous floor of the price is maintained, can we expect a failure from above and see higher price areas?

Chainlink Great Pre-2025 Bull-Market Prices —Amazing OpportunityDoes Chainlink look high right now to you? In the very near future, when we look back to this date, we will be thinking that the price was cheap, and cheap is a cheap word. Highly affordable, great pricing, an amazing opportunity... Soon, it will be gone.
Good afternoon my fellow Cryptocurrency trader, I am happy to write for you again today.
Chainlink (LINKUSDT) is not different and is no exception, it will go through a major bull-market in 2025, and this late 2024 pricing is the accumulation zone.
The period between May 2022 and October 2023 is the first accumulation after the bear-market, then we have the initial bullish breakout or relief rally, the end of 2023 and the start of 2024. Now we saw a correction and everything stops, it won't go to new lows, for the market to be technically bullish and to continue bullish, it needs to produce a higher low, you can see this clearly on the chart.
First consolidation is the low. The second consolidation contains the higher low.
The first consolidation last a long time. The second consolidation is short.
The first consolidation produces a small bullish wave. The second consolidation is the start of a major bullish phase.
Now, think of a price of $86 and the current price and you have a 535% target. And this is a conservative price, thinking of what Bitcoin is doing, this early in the game, tells us that prices will go reach much higher by the end of the next bullish phase.
For LINKUSDT, we can consider even $130, $178 (1,200%) or more, $224... When we look back to this time we will think, "Man, prices were so cheap back in late 2024."
Namaste.

Accumulation Phase with Eyes on ATH🔸 LINK has experienced a significant drop, declining around 90% from its all-time high, reaching a bottom around the $5 level.
This downtrend has allowed the price to capture both sell-side and buy-side liquidity. A bullish movement followed, and after testing key liquidity levels, LINK appears to be setting up for a potential upward move.
🔴 Liquidity and Support Zones: After reaching the internal range liquidity (IRL) zone, LINK has shown signs of support and is currently bouncing back. This indicates possible accumulation and readiness for a rally as it captures more buy-side liquidity. As the price moves upward, the next potential target could be the all-time high.
✅ Target Projection: If LINK continues its bullish momentum, it may aim for the $39 range. However, this projection remains valid only if key support levels are respected, specifically the $8 level.
🔑 Key Levels to Watch:
A candle closing below $8 would invalidate the bullish setup.
The current price level is ideal for accumulation for those preparing for a potential bull run.
Note: This analysis is provided for informational purposes only and should not be considered a buy or sell signal.

Momentum Rating Update - LINK/USDTOur Bullfinder AI Tech has identified a potential opportunity within Chainlink BINANCE:LINKUSDT over the coming weeks and months, rating LINK as 'bullish' above $14.29...
Upon reviewing latest developments, our founding Team have identified $11.83 as an important price point to monitor. If price moves below this price point, bearish continuation risk may increase substantially.
We look forward to bringing you more great content within our publications, and thank you for being here with us!
Love & Wisdom,
Team at Bullfinder AI

Chainlink (LINK) Price Analysis: Potential 74% Upside BreakoutThis chart shows an analysis of the LINK/USDT (ChainLink/Tether) trading pair on the daily timeframe. The red diagonal line represents a previously established downtrend, which appears to have been broken, indicating a potential shift in momentum to the upside. The green horizontal line at $22.87 is marked as a potential price target, showing a significant upside movement of approximately 74.8% from the current level.
There is a green support zone in the $12.56 region, which has acted as a strong base for price consolidation. The price has already rebounded off this support area, suggesting buyer interest at these levels. The moving average shown in green also aligns with the overall bullish sentiment as the price moves above it.
The projection illustrated by the white zigzag line indicates an anticipated retracement or consolidation phase before a strong upward push towards the target at $22.87. The projected increase implies a bullish outlook with a substantial profit opportunity.
Traders considering this trade should be mindful of potential pullbacks within the support zone or resistance at interim price levels. Keeping an eye on volume and market catalysts can provide additional confidence in the move reaching its 76% potential gain target.


LINKCrypto market has erupted from its sideways period. Bitcoin pushing all-time high and many altcoins following the trend. Almost all coins are having significant move. LINK can be one of many altcoins with solid fundamental. It covers some of trending crypto narratives that include Defi and RWA. LINK is also operating through many collaboration around the globe.
Price action wise, it is pretty simple. Breaking out from its trend line with supporting volume. Watch $30. SEND IT
