Why LINK Will Pump Back To $13 Quickly (Or Fall Below $9.5) LINK is probably one of the most undervalued tokens at this time. Especially in its Bitcoin pair, Chainlink still trades almost at its cycle low. However, this post is not about the long-term potential of LINK. On the contrary, it is about short-term price movements — and at this point, it looks quite promising. Here's why 👇
LINK currently trades at ~10 USD. More importantly, the price is slightly above a major consolidation channel in which LINK has traded for 17 months (!!!). On the other hand, the channel between has been a consolidation area for a couple of months, too.
However, LINK has never traded in the area between these two channels (9.5-13 USD) for a long time. Historically, this has been a speedway either up from 9.5 to 13 USD or vice versa.
Accordingly, it is highly unlikely that we will see LINK trading at this level for a long time. Based on the upcoming bullish momentum, I would expect a quick move back to the 13-level—or at least consider this scenario highly likely.
However, in case of a momentum switch (e.g., escalation in the Middle East), LINK has to stay above 9.5 to avoid entering the bearish consolidation zone!
LINKUSDT.P trade ideas

ChainLink Pre-2025 Bull-Market Accumulation Zone & StrategyHello my dear friend,
Notice the huge difference between the bullish wave in 2021 vs the bullish wave in 2023!
This is why I dubbed 2023 the "recovery year." Last year many Altcoins produced a nice wave, a recovery but definitely not a full-blown bull-market. Of course, there are always exceptions to the rule.
The full-blown bull-market is set to happen next year —2025.
The accumulation phase after the bear market (long-term correction), lasted 530 days.
This type of very long accumulation phase drives many people away from the market. By late 2023, not many people were around to enjoy the bullish wave that ended earlier this year.
A small bullish wave in 2023 (compared to 2021), ending early 2024, will be followed by a short accumulation phase.
➖ The next accumulation phase won't be as long as before.
➖ The next bullish wave won't be as small as before.
👉 The next bullish wave will be huge, we are set to experience massive growth.
👉 ChainLink has the potential to hit $85 as the next All-Time High, if things go bad. The true potential go as high as $135, and this is more likely.
We have to consider that Bitcoin is now mainstream and even the Altcoins are getting full worldwide exposure. Everybody will be rushing to buy, hold and use Crypto for speculative purposes and as a means to exchange value.
The last bullish cycle was truly great —2021.
What we are about to experience next is something we cannot even comprehend; The numbers will be off the chart, literally.
Strategy: Buy and hold.
It is easy to get confused when we are taking about "high frequency trading," computer bots and algorithms, complex strategies and energy draining garbage.
I read a trading book that was 700 pages long; text, text, text.
The real tips were given in just a few lines and the rest was just jargon to confuse people. Trading is so simple that the "experts" need to write books with all sorts of nonsense so that people get lost and fail to figure out how simple it all is.
One just needs to look from far away, detach with capital on hand.
Wait for the right market conditions and buy in big and wait.
When euphoria and greed sets in, sell. And that's it.
There are no Elliot Waves, no Gann Fans, no Fibs., no Candlesticks, no Bars, no Fundamentals, no News, no Products, no Merge; no, no, no. It is all very simple... Hey, here is Bitcoin; buy and hold.
➖ If everybody is super hyped up and already talking about it, this means it is too late.
➖ If the environment is cool, relaxed, there is no rush and even some fear and depression, buying can be best.
➖ When the market is depressed, doubtful, trading low near support; that's the time to jump-in.
➖ When everybody is celebrating paper earnings and counting their profits; that's the time to quit.
It is just the way it is.
We can learn and study, it is useful, it can be profitable, it can be fun.
But if you are here to make money, just buy and hold.
Buy and hold with the idea of waiting for years... If you can wait for years; No leverage, no margin; no risk; in the end, you are sure to win.
It is truly that easy.
In one year's time, you will see what I mean.
I hope that you are around in late 2025... If you are reading this now, you have great timing.
Namaste.

Chainlink (LINK): Head & Shoulders Still Did't Fill The TargetChainlink made a magnificent break of the neckline zone on the bigger timeframe but it did not yet fill the major target zone to consider this movement to be finished.
Once we break that zone at $8, we should see some sideways movement inside the sideways tunnel!
Swallow Team

A 40% correction for Chainlink to $8?On the above weekly chart price action finds resistance at market structure, which was first confirmed on March 2022. The recent confirmation of resistance follows a lower high print.
A Head and Shoulders print is now evident. This print occurs as RSI resistance remains active. It is highly likely the Head & Shoulders neckline fails.
A confirmation of the Head and Shoulder print forecasts a further 40% correction, which is exactly at past resistance.
Price action will arrive at $8 should the correction complete. In the big picture (below), the downtrend channel must show support on the mid line. Otherwise price action continues to correct until the $3 area over the next 1 to 2 years.
Ww
The big picture

Lingrid | LINKUSDT bounced off the DEMAND zoneBINANCE:LINKUSDT has bounced off the demand zone, which was tested last time in October 2023. The price skyrocketed from these levels last year and reached the price level at 22.0. We can observe that the market liquidated a significant number of long positions. On the weekly timeframe, the market filled the gap zone between 8.0 - 9.0 and moved above the psychological level of 10. I expect the market to continue moving higher, as the daily candle closed with a wick, indicating rejection of lower levels. My target is the resistance zone around 12.0
Traders, if you liked this idea or if you have your own opinion about it, write in the comments. I will be glad 👩💻

Chainlink (LINK): Possible Head & Shoulder Pattern!Chainlink caught our attention in the daily timeframe, with a possible good drop to happen soon.
As you can see, we are seeing a nice H&S pattern where the price once broke the neckline zone and now went for a re-test of the EMAs and the broken zone.
From here on, we are looking for a nice rejection to happen and a downward movement to start!
Swallow Team

What Is Happening With Chainlink?The last four days closed red on the LINKUSDT trading pair.
A common signal across all pairs showing top potential is the decreasing volume as new highs are hit. The decreasing volume is accompanied by a bearish divergence with the RSI; somethings weak, sometimes strong. In the case of Chainlink, the divergence is four months old.
Just closing below EMA10 changes the potential from bullish to bearish.
Closing below EMA21 confirms the short-term bearish bias.
Yesterday, LINKUSDT closed below EMA21 and before yesterday below EMA10.
Finally, we have a rounded top pattern and this can indicate that the top is already in place.
Patience is key.
We buy low to sell high.
Namaste.

ChainlinkHead & Shoulder pattern has formed, either it sustains its neck line or breaks below.
Lets have some your views on it. Should buy around neck line or wait for break out for more discounted price. Leave your comments with your views.

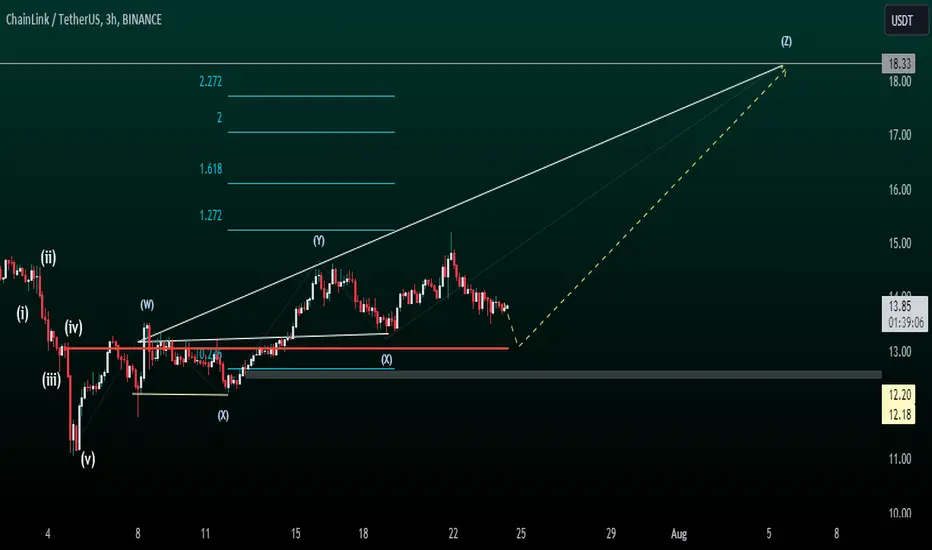
Chainlink Bullish ProjectionHello there,
Chainlink shows a potential bullish projection to 18.33, provided that 12.68 remains intact. The alphabetical sequence follows W → XYZ, with four potential bullish targets.
Note: The price could pulse down before turning up, as a piece to note. So, close monitoring will be required.
Happy Trading,
K.
LINKUSDT - SHORT [Daily Signal]LINK is too weak as for me - filling shorts from now. Hope this ETF hype will bring good entry averages.
Futures position, spot chart just smells delicious
Stay tuned, folks.

LINK is ready to returnAccording to what can be seen, the market still intends to fall to lower prices, but from where I see the link currency, the probability of returning from this area is very high. Please like this post and follow me.

Buy Link nowNow Link is at the strong support, let take a position and wait for a pull back like a professional trader

LINK looks bearishLINK structure looks bearish. We have had lower H and L .
So it is better to look for sell/short positions in resistance ranges.
We are looking for sell/short positions on the supply range.
Closing a daily candle above the invalidation level will violate the analysis
Note that the financial market is risky, so:
Do not enter a position without setting a stop and capital management and confirmation and trigger.
When we reach the first TP, save some profit and try to move the stop continuously in the direction of your profit.
If you have any comments please post them, comments will help us improve our performance
Thanks

CHAINLINK UPTREND CONTINUATION VS A WEAK PERFORMING DOLLARI am looking for the continuation of the uptrend we see on the larger timeframes on Chainlink USD, The Fed have decided to not cut interest rates, meaning in the dollar will have some short term strength, NFP and unemployment rates will be out today at 15:30 GMT and I can see them being negative, Chainlink on the other hand continues to keep stable prices acting unaffected by the other asset classes due to its inherent value.

BUY LINKUSDTevery one selling selling. now its ready for go to UP. bcoz retailer is now thinking its going down. game start now. its ready for up. many diversion created.

Link Spot LONGStarting to build a spot position under 13.
Invalidation clean breaking below 12.
Targeting 35.
Note: Not a Financial Advise.

Chainlink (LINK): Possible Rejection From 200EMAChainlink is back below 200EMA after having bounced from the bullish trend here.
He is keeping it simple here this time and looking for a possible rejection from 200EMA (which as of now has been working out well). So if we manage to secure this day as well as further downward movement, we should see a touch of trend this week!
Swallow Team

Incredible rebound on linkAs I said in my previous short idea, link is my top chart after the 4month consolidation.
this comes in confluence. A strong push from the 38.2 value area.
Looking for bulls to remain in firm control, if this H4 candle closes as an bullish engulfing pattern.
will update when candle closes.

Testing How to share trades for the first time. Hello to all of the traders out there. I am a moderator for the crypto banter school and will be sharing trading ideas and strategies soon. Anybody have any good tips on how to get links when we share that would be great. This is just a test. Good TA coming. Most people know me as CoinDivaSniper. Hello from the USA. What would you like to see charted?

LINK — Way To Go To Turn Bullish!LINK has been one of the stronger tokens in recent days. In fact, it recovered quickly from its drop below the crucial $13 level. However, LINK is still far away from turning bullish.
One of the best indicators to show this is the Ichimoku system.
When adding the Ichimoku to the chart, you can discover three aspects that need to change to turn bullish.
1—Despite several attempts, LINK didn't manage to break out of the cloud. This would be the first and essential step in establishing bullish momentum.
2 - The future cloud shows an upcoming bearish continuation. Although the cloud is getting narrower, we are still away from a crossover.
3 - The Kijun line (red) is getting closer to a crossover. A situation LINK should avoid by all means.
To initiate a bullish trend, the breakout to the top of the cloud would be essential.


Long position on LINKUSDT 49Min/ Volume PredictionBINANCE:LINKUSDT
COINBASE:LINKUSD
High-risk status: 4x-5x Leverage
Mid-risk status: 3xLeverage
Low-risk status: 2x Leverage
⚡️TP:
13.72
13.85
13.95
14.09
14.23
14.34(In Optimistic Scenario)
➡️SL:
13.28
13.07
12.85
The Alternate scenario:
If the price stabilize below the trigger zone, the setup will be cancelled.

3H late link update
Double top, both with clear rejection pattern
rejection of the ema200
rejection of the ema55
currently broken down with force bellow ema21
The weekly Link chart is one of the strongest after this 4month correction. It has very high compression and is ready for a strong push up
Now, the healthy targets of this breakdown are marked in green. that 's where I am accumulating
