LINKUSDT 15M ideaby using Smart Money concepts and support and resistance level i think we seen LINK movie in same pattern.
LINKUSDT.P trade ideas

LINK Potential DownsidesHey Traders, in today's trading session we are monitoring LINKUSDT for a selling opportunity around 14.200 zone, LINK is trading in a downtrend and currently is in a correction phase in which it is approaching the trend at 14.200 support and resistance area.
Trade safe, Joe.

LINK - Possible Expanding DiagonalBIST:LINK
Possible Expanding Diagonal
Possible Expanding Diagonal + High Volume + Extreme Fear + 5 Elliott's Wave Count Down
What will you do with this information...?

Crucial Support Reqconquered — Decisive Moment Ahead!Similar to many other altcoins, BIST:LINK reconquered its crucial support line.
Closing above this area is critical to avoiding more selling pressure. However, this will only be possible if LINK reclaims the 59-60k level and sticks a landing on the daily chart.
Therefore, watching the next 6 hours might be more interesting than the upcoming UEFA finals

SHORT #LINKSHORT #LINKUSDT from $12.308
1h TF. The asset has drawn a cascade of levels, we enter only after breaking through the nearest, fixing targets for each subsequent level (dotted line to the right), the last fixation point is a large volume in the purchase zone, since only 9,000 BTC out of 50,000 possible were sold, we can catch a very good movement, if we consider the graph from the side of wave analysis, then the fixation point can be Triple the size

LINK BUY/LONG SIGNALLINK BUY/LONG SIGNAL
We have a breakout of the downtrend in 1H
as long as it stays above 14.52 the we might see a price increase up to 16+
Our Purple MACD is gaining momentum.
Full Take Profit at 16.77 if we allowed to.
TP1 15.21
TP2 16
TP3 16.77
SL under 13.26
Risk 2% of your account and play on Spot or low leverage (2-5x)

Chainlink (LINK): Looking Good For Short ? Chainlink is testing that major resistance zone in a 4-hour timeframe, and 200EMA is also backing up this zone.
We are looking for a re-test to happen anytime and as soon as we see that sellers have defended the resistance zone, we should see a nice re-test to lower zones here.
Swallow Team

LONG #LINKUSDTLONG #LINKUSDT from $14.6 stop loss $14.3
15m TF. Despite the strong seller's pressure on the market, this instrument is held inside the sidewall and is perfectly bought off, there is increased activity from the buyer, trading volumes have grown locally, through the withdrawal of liquidity beyond the nearest minimum, they have squeezed under the previously formed hourly level from three touches at around $ 14.6, the breakdown of which I will consider, above there is also a cascade of highs on the senior TF which in turn will act as a magnet for price movement, I expect to see continued growth with the potential to reach $15.1

LINK USDTLINK Trade Setup.
After a confirmed breakout from the green zone, we could take entry at $14.928.
Remember stop loss is your friend. Everything is on the chart.
Entry $14.928
S.L $13.775
T.P 1 $15.911
T.P 2 $16.997
T.P 3 $18.035

Link near the shopping zone under LONGThe link is moving around the buying zone, from which a potential rebound may result in an increase of approximately: 33%, 61% and 109%. It is worth including a stoploss around $10 in case the BTC price starts to drop rapidly.

#link#link
This is the head and shoulder pattern,
Break out and confirm,
But #link did not hold the support (neckline) because of the small negative things in the market regarding #Metamask
What next ?
I think , not invalid till...
What do you think?👇
#NFA #DYOR

Linkusdt on supportLinkusdt is on support level which is major support we have now and its looking bullish now

LINK/USDT Technical Analysis in Weekly Timeframe.Hello everyone, I’m Cryptorphic.
For the past seven years, I’ve been sharing insightful charts and analysis.
Follow me for:
~ Unbiased analyses on trending altcoins.
~ Identifying altcoins with 10x-50x potential.
~ Futures trade setups.
~ Daily updates on Bitcoin and Ethereum.
~ High time frame (HTF) market bottom and top calls.
~ Short-term market movements.
~ Charts supported by critical fundamentals.
Now, let’s dive into this chart analysis:
The LINK/USDT weekly chart presents a technical analysis highlighting key levels and potential future movements. The update covers a multi-year perspective, focusing on critical support and resistance levels, trendlines, and possible price action patterns.
Key Highlights:
~ All-Time High Resistance: The chart marks the all-time high resistance level at $53, setting a target for the bull run.
~ Symmetrical Triangle Formation: The price action since the all-time high in 2021 has formed a symmetrical triangle pattern. Since last March 2024, it has rejected forming a consolidation pattern.
~ Strong Supporting Trendline: Since September 2019, LINK has respected a strong ascending trendline, which has acted as a critical support level through various market cycles. This trendline's integrity is essential for maintaining the long-term bullish structure.
~ Consolidation Zone: The green highlighted area between $7 and $9.5 signifies a significant consolidation zone where LINK has found strong support multiple times. This zone is important for price stabilization and potential accumulation.
~ Price Projection: The chart suggests a possible price decline to the lower end of the consolidation zone ($7) before a potential rebound. This projection aligns with the symmetrical triangle's support, reinforcing the importance of this level.
~ Relative Strength Index (RSI): The RSI indicator at the bottom shows a gradual recovery, currently around 47.11. A move above 50 could signal increasing bullish momentum although there is still room for further decline toward the oversold zone below 30.
Sweet Entry for LINK: $6 to $8.
Conclusion:
The LINK/USDT chart presents a mixed outlook with the potential for both bullish and bearish outcomes. The blue dotted line along with 100EMA holds good support for LINK. A breakdown below this will likely continue the consolidation.
DYOR.
Please hit the like button to support my content and share your thoughts in the comment section. Feel free to request any chart analysis you’d like to see!
Thank you!
#PEACE
#Chainlink

LinkLink head and shoulder pattern
Target is $16.167
Link break out the pattern and confirm it,
Put the Sl as per your strategy.

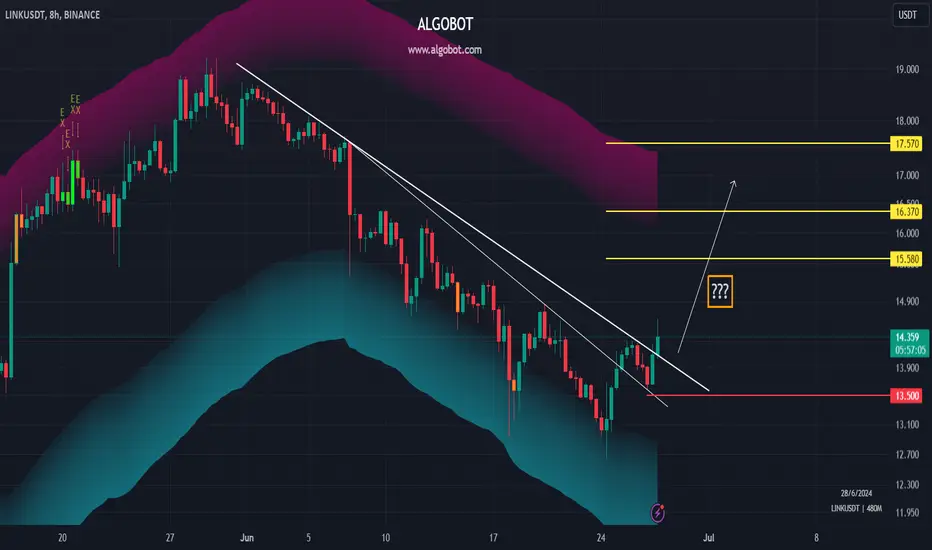
LINK 8H LONG setup - June 27 2024Looking at LINKUSDT in 8H timeframe, shows that it's probably heading for some higher levels.
Entry: 13.8 - 14.5
TPs: 15.58 - 16.37 - 17.57
SL: 13.5
Max lev: 3x (Futures)
Chainlink (LINK): Looking For Break of SupportChainlink is looking nice pressing that support zone (which looks like a neckline for H&S).
As we are still finding hard times to break that zone there, but pressure is on, so the game plan is clean, we are looking for a breakdown!
Swallow Team

LINK - A Simple "How To" Guide To Trade BIST:LINK
A simple "how to" guide to trade these corrective patterns from the Elliott's Wave Guidebook

#LINKUSDT: Will ChainLink Break Falling Wedge or Slip Further?Yello Paradisers! Are you ready for a potential breakout or a looming drop of #LINK? Let's dive into the latest analysis of LINK and see what might be next for #ChainLink.
💎#LINKUSDT has been trading within a falling wedge pattern on the 8HR timeframe. We're anticipating a bullish breakout that could drive the price toward the upper supply zone. However, as of now, #ChainLink is retesting the falling wedge's upper resistance level, and there is a possibility that it might not successfully break out just yet.
💎If LINK fails to breach the upper resistance, it's likely to retest the Bullish Order Block (OB) around $13.55. This level is also the Point of Control (POC) line of the Volume Range Volume Profile (VRVP), making it a strong support level.
💎However, if BIST:LINK fails to hold at $13.55, the next support level to watch is at $12.62. This area is packed with liquidity, increasing the chances of a renewed bullish rally if tested.
💎If the $12.62 support level fails to hold, we could see the bears taking control, leading to a bearish rally. The overall market sentiment and Bitcoin's movement will significantly influence #LINK's price action, so keep a close eye on these factors.
Stay focused, patient, and disciplined, Paradisers.
MyCryptoParadise
iFeel the success🌴

LInk scalping #LinkI am shorting Link and taking profits at appropriate levels. It's a good time to short because an indicator is showing a bearish divergence.

LINK - Broadening Wedge...?LINK
Will this Wyckoff Re-accumulation w/spring also turn out to be an Elliott's Wave Broadening Wedge...?

Chainlink (LINK): Watching for Key Support LevelsAfter a strong initial rise following our entry, BIST:LINK has started to decline again, raising the possibility that Wave 2 might not be complete and could fall further. It is crucial that the price does not fall below the 61.8% retracement level around $11, which coincides with a small high-volume node. This level should ideally act as support. Falling below $11 could lead to a rapid decline towards the $7-$8 range.
The RSI remains stable, suggesting that the current decline might be part of a normal corrective phase rather than a larger trend reversal. Therefore, we will keep our stop loss relatively wide to accommodate potential volatility, as we do not expect a fall below the $11 mark. If the price holds above this level, the bullish outlook remains intact.
We remain cautiously optimistic about Chainlink as long as it stays above the $11 support level. Falling below this could signal a deeper correction towards $7-$8, which would be a significant bearish turn. For now, we maintain our position with a broad stop loss to manage potential volatility and are looking for another DCA bid.
Yearly VWAP Analysis
When examining the yearly VWAP chart for Chainlink, we notice that the 2023 VAH (Volume Area High) and the 2020 VAH have been respected well. The price has dipped into this zone three times, each time holding it effectively. The 2020 VAH and 2022 VAH are critical levels that need to be reclaimed and held to turn bullish. Reclaiming these levels is essential for a sustained upward move. There is also a possibility that the price could retest the 2020 VAH once more.
It is crucial to maintain the support at around $12.18. We have been forming higher lows, indicating a generally ascending trend. This trend should not be violated by falling below the $12.18 support level. Successfully reclaiming the 2020 VAH at around $16 would be a strong bullish signal.
Maintaining the $12.18 support level is crucial for continuing the ascending trend. Reclaiming and holding the 2020 VAH at $16 would confirm a bullish reversal. Maintaining higher lows suggests an overall positive outlook for Chainlink.

LINK/USD Chainlink 50-60% correctionFED will not cut the rates
The potential that FED hikes the rates is now more than potentiall(Dont believe the so called experts paod by private crypto companies who share misleading information that FED will cut the rates)
SPXhad it firt red day exavtly as Dow made ALL TIME HIGHS.
Lin Bearish Short selling
Targets view on the chart
A break trap above 17,67 can lead to 18-25 before it falls deeper

LINK - Bullish DivergencesBIST:LINK - Printing Multiple Bullish Divergences while reprinting a 2nd Wave Fractal
