H&S on ChainlinkA clear H&S on both Bitcoin and Chainlink, after a massive upside on link almost hitting 20$
If BTC would head down to support levels between 32-36k, I anticipate a massive correction on Link. Possibly close to 10$
LINKUSDT.P trade ideas

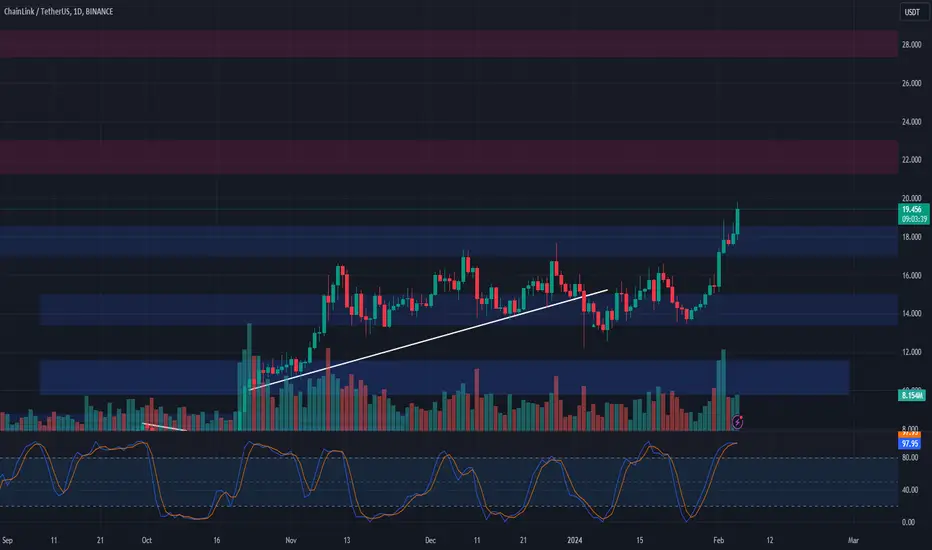
Big breakout after long Consolidation
Breakout swing trade
Leverage 10x or 20x
Stop Loss must
Book 1/3 profit after 3-5 days

Chainlink(LINK): Overbought or Bull Run?LINK is back after that massive breakout; it recently broke the major resistance zone that was a point of interest for us.
As that being said, we are waiting for a correction on LINK to happen where the price is currently in an overbought state and there is a high chance of re-testing that broken zone (the resistance of BB).
Swallow Team

LINK → Chainlink About to Breakout!? Let's Maximize Profits!Chainlink bounced off the top of the Resistance Zone at $20.00 and is threatening to break out. Is this a situation that calls for a long or a short?
How do we trade this? 🤔
Never long in a Resistance Zone! But also, don't short prematurely. I believe LINK will make an attempt to break out of the Resistance Zone, but we need confirmation of the break before we can enter a long trade. Wait for a strong close above $20 followed by a test of the Resistance Zone as support. Once we see a strong bull bar closing on or near its high after a bounce on the Resistance Zone, we have the justification to enter a long trade.
I do believe that Bitcoin has a high likelihood of pulling back into the $30,000-$35,000 range before we see new all-time highs. Such an event will likely drag the altcoin market down with it. This is partially why this trade is set up to take half profits at 1:1 Risk/Reward and move the stop loss up to the entry price, locking in profits. The remainder of the trade can then be executed without worry of loss.
💡 Trade Idea 💡
Long Entry: $21.60
🟥 Stop Loss: $17.185
✅ Take Profit #1: $26.00
✅ Take Profit #2: $34.85
⚖️ Risk/Reward Ratio: 1:3
🔑 Key Takeaways 🔑
1. Two strong pushes to the upside
2. Strong resistance at Resistance Zone
3. Price action still above EMA ribbons
4. Wait for a break, close, and test of the Resistance Zone as support to enter a long trade
5. RSI at 70.00 and above the moving average, supports pullback then long
💰 Trading Tip 💰
Trends typically have three legs in either direction. Signals of a reversal include strong buy or sell bars with large wicks, higher highs and lower lows get weaker, and responses to the reverse direction get stronger. Confirmation lies with double and triple bottoms with a strong candle closing on or near its low/high.
⚠️ Risk Warning! ⚠️
Past performance is not necessarily indicative of future results. You are solely responsible for your trades. Trade at your own risk!
Like 👍 and Follow to learn more about:
1. Reading Price Action
2. Chart Analysis
3. Trade Management
4. Trading Psychology

ETH - LINK comparison. Link moving into 2nd bullrunSimilar movement and chart pattern moving into Chainlinks second bullmarket

Bull flag on LINKLINK pumped when the rest of the market was down. LINK tends to lead the next leg up for BTC by a few weeks. This is a fairly clear bullflag with a projection past both of my short-term price targets. There is a strong consolidation on the first historic price target, this is bullish. The stochastic RSI is pointed downward, if we can get a reversal soon this flag may play out. The flag termination just so happens to be around the almighty golden fib.

LINKgot 3 possible scenario for $Link. These 3 are areas for the possible bounce before going to my bias. A broken structure on a DTF is a signal for me that I will take long here.

Long trade www.tradingview.com
4Hr TF
29th Jan 24
Observed (BOS)
12pm to 1.00pm
Entry: 14.643
Price:
17.329
Stop level:
14.125

"Patterns hidden by patterns."No financial Advice.
“There are only patterns, patterns on top of patterns, patterns that affect other patterns. Patterns hidden by patterns. Patterns within patterns.
If you watch close, history does nothing but repeat itself.
What we call chaos is just patterns we haven't recognized. What we call random is just patterns we can't decipher. What we can't understand we call nonsense. What we can't read we call gibberish.
There is no free will.
There are no variables.”
― Chuck Palahniuk, Survivor

LINK (Y24.P1.Video1). Macro overviewHi traders,
My thoughts on LINK and why I"m looking for high levels. As for looking for an entry, there is one clear level / potential setup otherwise its difficult to find an entry at this point.
When or if we get certain levels, I would be looking to short however my HODL is long term so I cover the potential macro targets as well.
Please give me a like and share,
Regards,
S.SAri

$LINKUSDT 1 WEEK#LINKCHAIN (LINK) has successfully broken above the consolidation zone after being trapped there for long.
The pair is currently on a very BULLISH move , and is approching a RESISTANCE zone at $22 - $24. Nothing much to do now, probable entry opportunities will appear once the RESISTANCE is broken or in case of further CORRECTION.
Hit 🚀 if you like it.

BINANCE:LINKUSDT +180% profit potential on the long termLINK is on the target to reach it's previous All time high of 53$ and its about time before it breakout from the ATH and reach new ATH my target $250
I'm expecting some correction before we can see some correction before its can hit ATH.
You can enter for position at $18 with 2x leverage.
Regards,
VectorAlgo

LINK/USDT BEARISH BUTTERFLYThe price created bearish harmonic pattern, if there is rejection we will see the price will drop to the target area.
Happy trading!

ChainLink (LINK) Price Analysis: Identifying Key Market PhasesThis detailed chart a technical analysis of the ChainLink (LINK) cryptocurrency against Tether (USDT) on the Binance platform. As observed, the LINK price movements oscillate between two key market phases: Accumulation and Expansion.
Starting from the left, the chart begins with an 'Accumulation' phase – a period where price action is relatively flat and confined within a tight range, indicating that investors are accumulating the asset. After accumulation, the market enters an 'Expansion' phase, where prices break out of the range and trend higher or lower, as shown by the sharp upward and downward movements.
The annotated chart projects future market behavior based on historical patterns. After a phase of expansion, it is anticipated that the market will revert to accumulation, where the price stabilizes before the next expansion phase. This cycle is expected to repeat, reflecting the market's natural rhythm of growth and consolidation.
The price levels are clearly marked, indicating past and potential future resistance and support levels. Key price points, such as the previous high, are highlighted to provide strategic insights. Moreover, the green and red shaded areas represent potential zones where price action may be more bullish or bearish, respectively.
Understanding these market phases can be crucial for traders looking to make informed decisions on entry and exit points. It's important to note that while historical patterns can provide guidance, they do not guarantee future outcomes. Traders should use this analysis in conjunction with other indicators and market news."
Feel free to adjust the description to better fit your analysis or the message you wish to convey to your TradingView audience.

#LINK/USDT#LINK
The price is moving in a cross channel pattern 1 D frame
It is expected that this channel will be penetrated upward with stability above the Moving Average 100
We have strong support to rely on at the borders of the lower channel
Also we have oversold on MACD
Current price 15.74
First goal 16.79
The third goal 18.29
Third goal 19.89

⚖️💹 LINK Analysis and Strategy 🌐📊📊 Current Market Status:
LINK has been consistently rising since breaking out from the $8 area in October.
📈 Chart Analysis:
Daily Chart: Possibility of retest of $18 area.
Weekly Chart: Strong, targeting next resistance at $28.
🔄 Trading Strategy:
Retest Opportunity: For those who missed the earlier move, look for a possible retest of the $18 area on the daily chart.
Weekly Target: On the weekly chart, LINK appears strong with a target at the next resistance of $28, representing a more than 50% move up.
📣 Market Insight:
LINK's strength is evident, and as long as Bitcoin remains stable, it may continue its upward movement without significant disturbances.
Trade wisely! 📈💡 #LINK #TradingStrategy #CryptoMarket 🌐📊