Chainlink: Your Altcoin ChoiceI was about to call it quits for today but several people requested an analysis for LINK, so here it is.
Oh, by the way, I like Chainlink also and tend to publish many updates. Just lately I was out but now I am back healthy and with full force.
There are two main dynamics playing out on this chart that are of interest to us:
1) A perfect falling wedge pattern. This pattern is a classic reversal signal and one of the most accurate. It simply works.
2) A long-term support/accumulation zone. The falling wedge is enough to predict a reversal, but the action just entered the late 2024 buy zone and long-term support. This makes it even stronger.
I am sure we have positive signals coming also from the MACD and RSI.
This chart is based on the long-term. Again, if you would like to find the 2025 ATH for this or any other pair, just go to my profile by typing on my username and search for the pairs name. In this case, LINKUSDT, you will find many publications that are still good and valid when it comes to the numbers and ATH potential. I published many in 2024 and some even in 2023.
Now, the apex of the falling wedge is a higher low compared to the bottom in August 2024. This is good and works to support the other signals.
Trading volume is very low on the drop and this is also very good for the bulls. The market is on autopilot. It is dropping just because it needs to drop. Bot selling. Bot selling ends when real buying starts. We are about to experience a massive influx of money into the market.
Now, money is already "programmed." The exchanges already have the whales money. Money has been moving around for months now and the entire game is already setup. The start of the next bullish cycle has been programmed, you know everything works with algorithms and bots. The big players pay the exchanges and the exchanges take care of the rest. The only way for small players like us to win is by playing the long-term game. If we play short-term, we get killed because we are looking for 20-30% or more, while the whales can profit with 1-2%. While we try to complete a trade, they shake us out over and over, again and again. So instead of fighting the whales we use a strategy that works. We wait for the market bottom, when the market hits bottom or is close to the bottom, near support, we buy and hold.
We then just wait and let the bullish cycle unfold. When everything is up, we collect profits and move on.
There is also a play to short the market after the end of the bullish phase. I also play this hand and give guidance to my followers and traders, but this is far away.
Right now your only concern should be buying, buying like the world is about to end. Why? Because once the market starts moving there is no going back; once great entry prices are gone, they are gone forever.
The time is now.
Chainlink is good and trading near long-term support.
Buy when prices are low, it will soon start to grow.
It can take weeks or days, but it won't be long. The next bullish cycle should last between 6-8 months. It can expand at last 12 months or more. We will have to see about this part because market conditions are so different now, who knows if we will enter a 10 years strong/long bull market cycle, it is possible, just like it happened with stocks. But we can only prepare based on what we know, and what we know is that most of the market will grow really strong. If it gets better, great. If the bull market ends up being a standard one, this would still be awesome.
Thanks a lot for your continued support.
Namaste.
LINKUSDT.P trade ideas

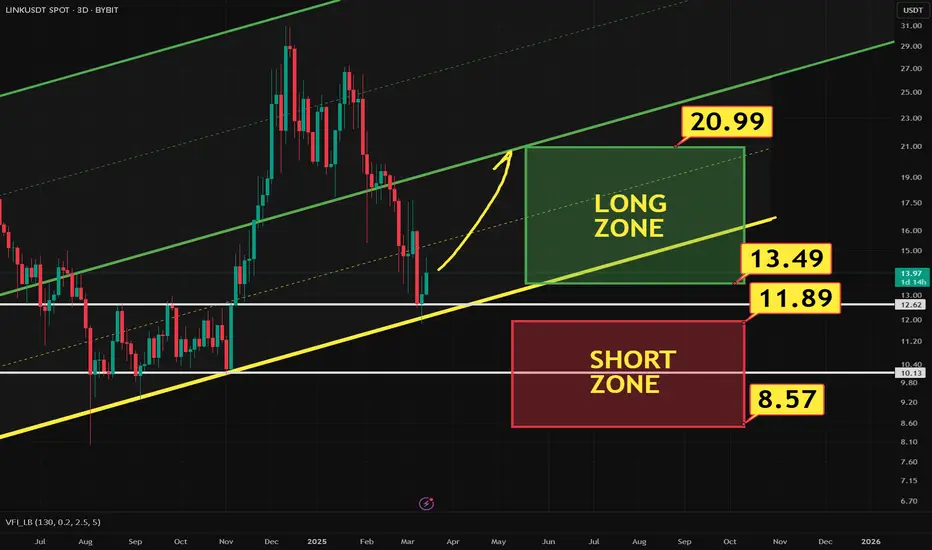
LINK Long Spot Trade Setup – Major Support TestLINK has retraced sharply and is now sitting at a critical support zone ($10.00–$11.00), historically a strong base for reversals. This offers a solid risk/reward opportunity for a potential bounce and test of upper resistance zones.
📌 Trade Setup:
Entry Zone: $10.00 – $11.00
Take Profit Targets:
🥇 $17.00 – $17.70
🥈 $21.70 – $22.40
Stop Loss: Around $8.80

Link is still above a key support level , what's next ?Hello Traders 🐺
In this idea I'm goanna about to take a quick look on LINK because as you might already known I'm a big fan of LINK and I think it's about to do extremely well in this cycle ;
As you can see in the chart price is already above a key support level which is monthly support and created a lower low in the price but higher lows in the RSI value , which cause to this bullish divergence , also LINK/ETH is showing some strength again so that means we are about to see LINK out performing ETH in this Altcoin Season because LINK/ETH chart have a strong bullish pattern on the monthly chart , you can also check it here :
as you can see what we have here , is a double bottom formation on the monthly chart , my price target for it is somewhere around 0.5 or 0.618 fib level .
in the short term I expect a test to green resistance line ; act accordingly my friends also I posted a very important idea about BTC.D here , make sure to read it carefully because it's also even more important than this idea :

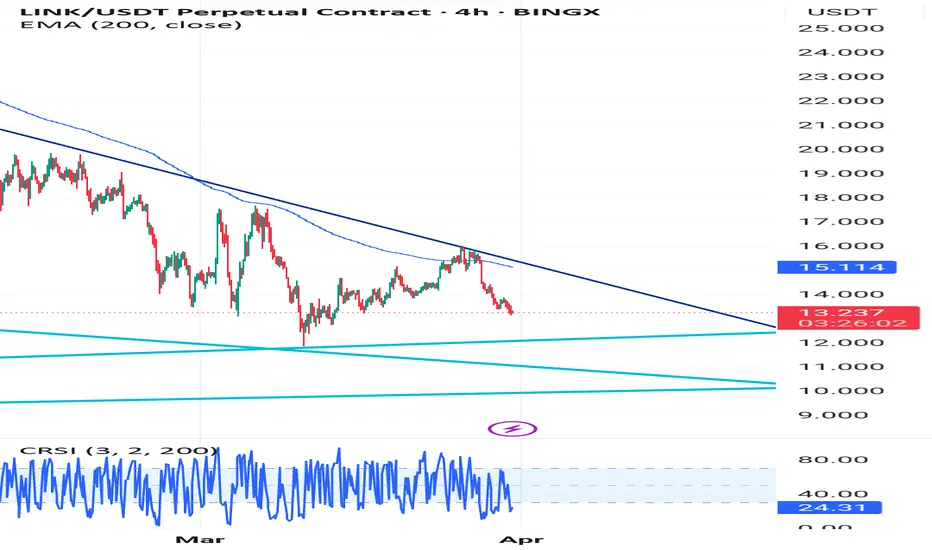
Chainlink (LINK) at a Make-or-Break LevelBINANCE:LINKUSDT.P has been trapped inside a descending channel and is now sitting on a key support zone around $12.60 - $12.75. The market is at a critical decision point—will we see a reversal or a deeper breakdown?
🔍 Key Technical Insights:
📉 Descending Channel: LINK has been in a bearish trend, making lower highs.
💧 Liquidity Hunt: Price may sweep below support to trigger stop losses before reversing. It has already been attempted once and again rebounded.
🏦 Order Block Zone: The previous accumulation area (Sept-Nov) could act as strong support.
⚠️ Breakdown Risk: A clean close below $12.60 could open doors to $10 or lower.
📌 What to Watch?
🚀 Bullish Scenario: If the price wicks below support but reclaims it, expect a rally toward $15+. If the price breaks above 15$ hopefully it'll continue further the bullish movement
⚠️ Bearish Scenario: A confirmed breakdown of $12.60 could signal further downside.
🔥 Will LINK bounce from this high-liquidity zone, or are we heading for lower lows? Drop your thoughts below!👇
Follow for more crypto updates.
Don't forget to hit the like button.


LONG Position LINK/USDT#Singal
LINK/USDT
🟢 LONG Position
🎲 Entry1 @ 12.47
✅ Target1@ 13.62
✅ Target2 @ 15.54
✅ Target3 @ 18.87
✅ Target4 @ 23.98
✅ Target5 @ 30.25
❌ Stop Loss @ 9.69
Leverage: 5X
Margin: 5% of Wallet Balance
⚠️"Take Care of Risk Management for Your Account"

Short Position LINK/USDT#Singal
LINK/USDT
🔴 Short Position
🎲 Entry @ 14.00
✅ Target1@ 13.90
✅ Target2 @ 13.75
✅ Target3 @ 13.51
✅ Target4 @ 13.25
✅ Target5 @ 12.97
❌ Stop Loss @ 14.55
Leverage: 5X_15X
Margin: 10% of Wallet Balance
⚠️"Take Care of Risk Management for Your Account"

New highs - don’t be fooled by the news Bullish divergence on the 3M chart forming on RSI indicator. Very very high probability of seeing new highs. The trend is still in continuation upwards. Dont be fooled by the news. Numbers are more important than words.
Stay blessed.
DYTRDR.

LinkThe movement of this currency in the chart
Link
It is easy to see the movement towards the floor and ceiling of the chart. I find it impossible that the price will fall below 12
ChainLink Technical AnalyzeTrend: ChainLink is also in an ascending channel, but it's currently testing the lower boundary.
Support: The green support at 11.50–12.00 is critical for a potential rebound.
Resistance: The red resistance at 53.17 is the first target for price movement.
Volume: Volume is picking up slightly, suggesting some momentum.
Price Action: Monitor the green support zone. A bounce from this level could target the resistance at 53.17.

LINK - Excellent Signal yesterday.Look at what i wrote about OBV line in previous TA.
OBV Broke the line and jumped in short.
Almost 9% till now 🎯 👌
BOOOOOM ... !
Look at original Signal from yesterday :
Follow for more ideas/Signals. 💲
Look at my other ideas 😉
Just donate some of your profit to Animal rights and rescue or other charity :)✌️

LINK - Nice Levels for Short Soon !OBV :
i wanna see a nice break out from white line or even better from pink line and retest.
Often OBV breaks out before price, which is a nice indication.
Chart:
I wanna see a nice break out from that void line (which is the previous POC too) and from blue trend line.
EYES ON ....
Follow for more ideas/Signals. 💲
Look at my other ideas 😉
Just donate some of your profit to Animal rights and rescue or other charity :)✌️

LINK/USDT - Bullish Channel Breakout and FVG Re-TestThe LINK/USDT chart showcases a clear uptrend within a bullish channel. Currently, there’s a potential retracement towards the Fair Value Gap (FVG) around the $14.50 zone, offering a possible entry opportunity. If this zone holds, a new bullish impulse could push the price toward the channel's upper boundary around $16.50. Watch for price reactions in the FVG zone to confirm the continuation of the uptrend.

Chainlink $LINK to 17$?⚠️ RISK TRADE ⚠️
👑 #LINK/USDT BUY 👑
Entry price:
13.76 - 14.17 🟩
Targets:
1️⃣14.62🎯
2️⃣15.24🎯
3️⃣16.04🎯
4️⃣17.05🎯

Chainlink LINK price analysisThe 6-year trend line has been keeping the #LINK price “in play” by 4 times
The next is patience and observation.
🆗 As long as the OKX:LINKUSDT price is above the blue trend line, then the medium-term targets of $38 and $53 are still relevant.
_____________________
Did you like our analysis? Leave a comment, like, and follow to get more

LINKUSDAccording to previous analysis and monitoring of this currency for a long time, the probability that the price has started its upward trend is high and our team will be a buyer with any decline in this currency for high targets (the ceiling of the descending channel).

LINK/USDT: Strong Momentum Points to Higher TargetsThe LINK/USDT pair has shown strong bullish momentum on the 1-hour timeframe, breaking above both the 15.00 level and a downward trendline. On the daily chart, four consecutive bullish candles reflect persistent buying pressure.
Recent movements suggest an ABC pattern is unfolding, hinting at a potential push toward the 17.00 resistance level. With momentum building, the market may soon test this zone, barring any negative news that could prompt a sell-off. A pullback may occur short term, but the overall outlook remains bullish, with a mid-term target at the resistance zone around 16.45

LINKLINK
March 26, 2025
8:02 AM
CRYPTOCAP:LINK just had a clean bounce off the +W OB (not a full-on impulsive move, but definitely a solid reaction)
Also, the MA100 and MA200 are forming a golden cross on both weekly and 4H TF — pretty bullish signal overall.
Looks like we’re setting up for W3. Right now, we’re in W2 and potentially about to enter W3 of W3, which is usually the strongest leg.

Lingrid | LINKUSDT short-term BULLISH Momentum in the MARKETThe price perfectly fulfilled my previous idea . It hit the target level. BINANCE:LINKUSDT has gained upward momentum on the 1H timeframe, surging above the 15.00 level and downward trendline. On the daily timeframe, we see a series of four consecutive bullish candles, indicating strong buying pressure. Recent price action suggests the formation of ABC signals, implying that the market is positioning itself for an upward move towards the next resistance level around 17.00. As momentum builds, it is likely to test this key level, which could lead to further price increases unless sudden negative news triggers sell offs. Overall, I expect a pullback followed by a continuation move. My goal is the resistance zone around 16.45
Traders, If you liked this educational post🎓, give it a boost 🚀 and drop a comment 📣

LINK Trade Setup - Higher Low ConfirmationLINK is showing early signs of reversal from a key higher timeframe support zone. We anticipate a short-term dip into the buy zone before shifting into an expansion phase.
🛠 Trade Details:
Entry: $13 – $14 (Buy Zone)
Take Profit Targets:
$17.00 - $17.70 (Initial Resistance)
$21.70 - $22.40 (Breakout Target)
Stop Loss: Daily close below $12
Looking for higher low confirmation before the move up. 📈🚀

Chainlink Set for 100% Surge Amidst Strategic Partnership The Price of Chainlink ( CRYPTOCAP:LINK ) is set for a comeback with a potential 100% surge in sight- amidst striking a potential partnership with the Abu Dhabi Global Market (ADGM).
The asset is currently depicting multiple signs of a bullish renaissance with the daily price chart hinting at a bullish symmetrical triangle. Similarly, the daily Relative Strength Index (RSI) is at 52 hinting at a potential bullish surge incoming coupled with the falling wedge depicted in the chart.
Chainlink ( CRYPTOCAP:LINK ) entered into a strategic partnership with the Abu Dhabi Global Market (ADGM) to promote tokenization in the UAE. As part of the collaboration, Chainlink and ADGM have signed an MoU to create a secure and legally sound environment for asset tokenization in financial markets.
Significantly, ADGM will provide regulatory guidance, frameworks for secure tokenization, and expertise in asset tokenization. At the same time, Chainlink will contribute its technical expertise, blockchain-based solutions, and tokenization infrastructure.
What Is Chainlink (LINK)?
Founded in 2017, Chainlink is a blockchain abstraction layer that enables universally connected smart contracts. Through a decentralized oracle network, Chainlink allows blockchains to securely interact with external data feeds, events and payment methods, providing the critical off-chain information needed by complex smart contracts to become the dominant form of digital agreement.
Chainlink Price Live Data
The live Chainlink price today is $15.47 USD with a 24-hour trading volume of $326,378,851 USD. Chainlink is up 2.47% in the last 24 hours, with a live market cap of $10,167,634,903 USD. It has a circulating supply of 657,099,970 LINK coins and the max. supply is not available.

Smart Money Is Loading LINK — Are You Late Already ? Hello Traders 🐺
As you know, I'm one of the biggest LINK bulls in the universe—but why? 🤔
If you've been following me, you already know Altcoin Season is coming, and what smart money does is pretty simple:
✅ Invest in solid, high-quality projects
✅ Track whale activity and institutional movements
📊 But how do we do that? Let me break it down:
In my last idea about LINK/ETH, I showed you a chart revealing that LINK is gaining strength against both BTC and ETH. Here's what you should know:
🔹 1. LINK/BTC Chart: Near All-Time Lows
Despite LINK being around $15 in USDT terms, the LINK/BTC chart is close to its all-time low. That means:
📈 When Altseason kicks in, and LINK returns to its ATH vs BTC, the price could hit $160 per coin — a 10x gain! 💥
Even if LINK only hits half of that previous ATH, we’re still looking at $80 LINK — that’s huge upside! 🚀
🔹 2. LINK/ETH Chart: Stronger Setup
The same story exists on the LINK/ETH chart, but this one’s a bit more complex. I’ve already posted an idea about this setup—you’ll find it linked to this post.
Right now, LINK is trying to outperform ETH, and that’s important. Why?
Because if ETH moves up 10%, LINK could jump 18%+ thanks to this strength. 📊⚡
🔍 This post focuses on the immediate short-term setup. My mid-term outlook is still being finalized—because, honestly, it’s a bit tricky to explain unless you're a pro. (No offense—I know most of my audience are pro traders 😎)
So let me expose that setup at the right moment. Until then, make sure to follow so you don’t miss my next updates! 📢🔥
Thank you for your support, my awesome audience 🙏💙
🐺 Discipline is rarely enjoyable, but almost always profitable 🐺
🐺 KIU_COIN 🐺

LINK at a crossroadsIt is a very suitable coin for both long and short positions. There are two channels. It is debatable whether it can be as strong as its old bull. But here's how to make money. not investment advice