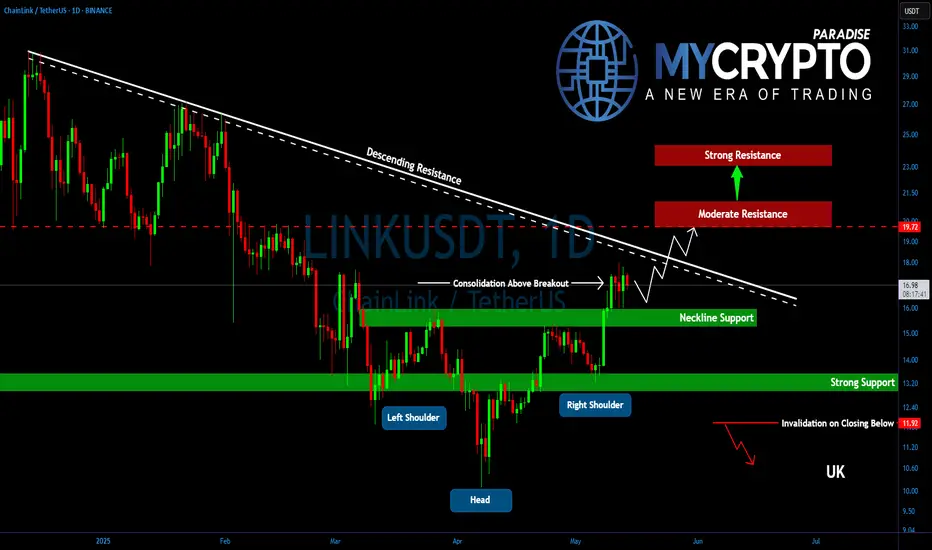
Is LINK Preparing for a Parabolic Rally? Key Levels to WatchYello, Paradisers! After completing its ABC correction, #LINK slipped into a sideways phase — but something significant is brewing beneath the surface. The recent formation of an inverse head and shoulders might be signaling the start of something much bigger.
💎LINK has now confirmed a breakout above the key neckline at $16.00, a critical level that had been capping price action. Following this breakout, the price is holding its ground well and entering a post-breakout consolidation that often acts as the launchpad for the next explosive leg.
💎#LINKUSDT now faces a decisive resistance at $18.50, a trendline rejection point that has held strong since December 2024. A clean break above this level could ignite strong bullish momentum. If bulls succeed, we could see LINK pushing quickly toward the $19.70–$20.30 range, a moderate resistance area, where partial profit-taking is likely from experienced hands.
💎Should momentum persist, the next major upside lies between $23.25–$24.00, the measured target of the inverse head and shoulders breakout. This zone is not just technically significant due to the pattern, it also aligns with the 61.8% Fibonacci retracement, making it a high-confluence resistance.
💎On the downside, LINK has strong support between $16.00–$15.50. This is not only the breakout neckline but also closely aligned with the 50 EMA and 200 EMA, reinforcing this range as a robust demand zone.
Paradisers, strive for consistency, not quick profits. Treat the market as a businessman, not as a gambler.
MyCryptoParadise
iFeel the success🌴
LINKUSDT trade ideas
LINK/USDT is Nearing The UptrendHey Traders, in today's trading session we are monitoring LINK/USDT for a buying opportunity around 15.20 zone, LINK/USDT is trading in an uptrend and currently is in a correction phase in which it is approaching the trend at 15.20 support and resistance area.
Trade safe, Joe.

LINK: Breaks Out From A Clear Inverse Head & Shoulders PatternLINK: Breaks Out From A Clear Inverse Head & Shoulders Pattern
LINK has broken out from a strong Inverse Head and Shoulders pattern, signaling a bullish trend.
After the breakout, the price pulled back to retest the neckline, finding strong support near $14.90, where it reacted multiple times.
If this level holds, LINK could start a larger bullish wave, with potential targets at: 🎯 $17.60 🎯 $19.60 🎯 $21.60
The BTC price positions is the only tricky part but it can happen that as a minimum to push the price near to the first and second target.
You may find more details in the chart!
Thank you and Good Luck!
❤️PS: Please support with a like or comment if you find this analysis useful for your trading day❤️

LinkLink
Chainlink was created in 2017 by Sergey Nazarov and Steve Ellis, who co-authored a white paper introducing the Chainlink protocol and network with Cornell University professor Ari Juels the same year. Chainlink acts as a "bridge" between a blockchain and off-chain environments. The network, which services smart contracts, was formally launched in 2019.
In 2018, Chainlink integrated Town Crier, a trusted execution environment-based blockchain oracle that Juels also worked on. Town Crier connects the Ethereum blockchain with web sources that use HTTPS.
In 2020, Chainlink integrated DECO, a Cornell project co-created by Juels. DECO is described by its authors as a protocol that uses zero-knowledge proofs to allow users to prove information is true to a blockchain oracle without revealing sensitive information, such as birth dates. Chainlink published a second white paper in April 2021. That paper, Chainlink 2.0: Next Steps in the Evolution of Decentralized Oracle Networks, detailed a vision for expanding the role and capabilities of decentralized oracle networks to include hybrid smart contracts, which utilize on-chain code and off-chain services provided by oracle networks.

LINK/USDT – Setting Up for a Bigger Move? | 4H Market Structure Chainlink (LINK) has been consolidating tightly after a solid impulse move from the $13.5 region to the $18 zone. We're now watching for a potential continuation setup as price coils near a confluence of key technical zones.
Structure & Market Context
After peaking around $18, LINK has pulled back in a textbook retracement fashion. Price is currently hovering in the golden pocket zone (between 0.5 and 0.618 fib levels)—a common area where price often gears up for its next leg, either for continuation or breakdown.
More importantly, this retracement aligns with a confluence of trendlines that have been acting as dynamic support over the past few weeks. We're seeing clean reactions every time price taps the mid-line or base trendlines, suggesting bulls are still defending key levels.
What Makes This Zone Interesting?
200 EMA Support (Orange Line): Price is holding just above the 4H 200 EMA, which often acts as a springboard in trending conditions.
Volume Profile Cluster: The area around $14.95–$15.10 is a high-volume node. This is where a lot of trading activity happened previously—expect reactions here if price dips.
Liquidity Sweep: Price already dipped below some previous local lows, which may have grabbed liquidity. If bulls are serious, this is where they typically step back in.
Key Price Zones to Watch
$15.70–$15.25 → This is the primary area of interest. It sits right inside the fib golden pocket and matches up with the EMA and trendline support. Price holding here could mean a push back toward the mid-range.
$15.10–$14.95 → Strong volume support here. If we get a deeper pullback into this range and it holds, that could be the launchpad.
$14.40 and Below → Below this, structure starts to break. If we see strong candles pushing through this level, the bullish setup likely invalidates.
Upside Targets (If Structure Holds)
A push back toward the $16.30–$16.95 region seems likely if we get a clean bounce.
Above that, the $18 highs are back in play, especially if momentum and volume confirm.
In case of breakout, we could even be setting the stage for an extended leg beyond $18.5+—but let’s not jump the gun until structure confirms.
Right now, LINK is in a high-stakes zone—where either a strong bounce or deeper breakdown can develop. The chart is showing signs of healthy consolidation, and the confluence of support (trendlines, fib levels, EMA, volume) is too clean to ignore.
If price holds this region and buyers show up again, this could offer a solid risk-defined long opportunity with continuation potential. But as always, we wait for confirmation—never assume.
#LINK #Crypto #TechnicalAnalysis #SwingTrade #VolumeProfile #Fibonacci #Chainlink

potential short-term price increasepotential bullish movement in the near future, signals indicate upwards price movement

TradeCityPro | LINK: Eyeing Breakout as RSI Signals Divergence👋 to TradeCity Pro!
In this analysis, I’m going to review the LINK coin. This project is one of the well-known DeFi and Cross-Chain platforms, and it's considered one of the top projects in these categories.
🔍 The LINK token currently has a market cap of $627 million and holds a ranking on CoinMarketCap.
⏳ 4H Timeframe
As you can see, LINK has started a bullish leg, rising from $13.30 to $17.62. After a pullback that reached as low as $15.92, it has returned to test the previous high.
⚡️ If the $17.62 resistance is broken, the price could rally toward $19.42. Therefore, a breakout above $17.62 can be used as a long entry trigger.
📊 So far, volume has aligned well with the upward trend, and there are no signs of weakness from the volume perspective. However, if volume rises during a pullback or drops during a bullish move, it would signal a volume divergence, potentially indicating a trend reversal.
💥 Meanwhile, the RSI oscillator shows a bearish divergence. If RSI closes below the 50 level, this divergence would be confirmed, suggesting the possibility of a corrective move.
✨ To confirm a deeper correction or trend reversal, a breakdown below $15.92 would be significant. The next support after that lies at $15.22, with the main support far below at $13.30.
✔️ For short positions, I recommend waiting for clearer signs of trend reversal, such as volume divergence or confirmed RSI divergence. At the moment, there’s no solid short setup, and we need to wait for a suitable structure to develop.
📝 Final Thoughts
This analysis reflects our opinions and is not financial advice.
Share your thoughts in the comments, and don’t forget to share this analysis with your friends! ❤️


Chainlink Strong Higher High In The Making ($85.75 NEW ATH 2025)It seems pretty simple and there is no room for controversy here, Chainlink is moving to print a new higher high. The chart structure and market conditions are perfectly aligned for this event to take place.
Good afternoon my fellow Cryptocurrency trader, do you agree?
Chainlink has been producing higher highs and higher lows in the past two waves. The upper boundary of the post bear market consolidation channel worked as support in August 2024 and April 2025.
Since LINKUSDT consolidated for 525 days after the bear market, this becomes a very strong support. Seeing this support zone being activated twice, the second with a higher low, reveals what's to come.
The next move is a strong advance, the biggest since 2021 and very like a new All-Time High in this year 2025.
The chart is showing as the main target $64, but it can go higher; the projection for the 2025 ATH for LINKUSDT sits at $85.75... Or more.
Thanks a lot for your continued support.
Namaste.

Chainlink (LINK): Looking For Bounce From HereChainlink has reached the lower side of the local bullish trend, where we might be seeing some good upward movement very soon. We are looking for proper bounce and break of structure on smaller timeframes like 5M or 10M, after which we would be looking for a long here.
Swallow Academy

$LINK 6H Chart AnalysisBIST:LINK 6H Chart Analysis
LINK is retesting the breakout zone from the ascending triangle.
Price is holding above key support around $16.20.
A bounce here could ignite a move toward the $22.85 target.
- Entry: CMP
- TP: $22.85/ $19.23 / 21.32
- SL: $15.26
Bullish continuation likely if support holds!
DYRO, NFA

LINK (Chainlink) – Breakout Setup Aligned With BTC Macro MoveWith BTC on the verge of a new all-time high, the market is poised for high-beta altcoins like LINK to follow with strength. LINK is currently testing the 200-day EMA — a critical momentum indicator. If BTC confirms breakout and LINK holds this zone, it sets up a high-probability continuation play.
🔹 Entry Zone:
$16 (on confirmation of support at 200-day EMA)
🎯 Take Profit Targets:
🥇 $20 (prior range high / psychological resistance)
🥈 $25 (multi-month breakout level)
🥉 $30 (macro extension target)
🛑 Stop Loss:
Daily close below $14.50 (breakdown of EMA support and invalidation of current structure)

LINK/USDT - Long trade LINK / USDT Update 🔔
I couldn’t be more bullish on the LINK trade we’re holding right now.
We’ve got a textbook inverse head and shoulders playing out... neckline broken, perfect retest, and now a bullish engulfing candle confirming the move. Structure couldn’t be cleaner. This is exactly what you want to see after a breakout. Now could be a good idea to add to your position size on the LINK trade.
Holding strong here with eyes on the $18.20 and $19.53 short term targets. As long as price holds above the neckline zone, this setup remains high-conviction.
Big upside potential from here. Let’s ride it. 🔥

Chinlink market on 19/May/2025Chainlink is playing at Order Block zone and after retest Order Block zone. It will visit (17$ - 18$). When it break this level, it will claim to (19$ -20$) to r claim it bull trend.

LINK in coming Weeks ...The pattern has broken, and now I expect the price to rise to $36 . AB=CD.
previous analysis
Give me some energy !!
✨We spend hours finding potential opportunities and writing useful ideas, we would be happy if you support us.
Best regards CobraVanguard.💚
_ _ _ _ __ _ _ _ _ _ _ _ _ _ _ _ _ _ _ _ _ _ _ _ _ _ _ _ _ _ _ _
✅Thank you, and for more ideas, hit ❤️Like❤️ and 🌟Follow🌟!
⚠️Things can change...
The markets are always changing and even with all these signals, the market changes tend to be strong and fast!!

What's up with LINK?!(4H) (OVO)It like others has declined.Now has done a small correction.I believe It can continue the bearish and fall after correction

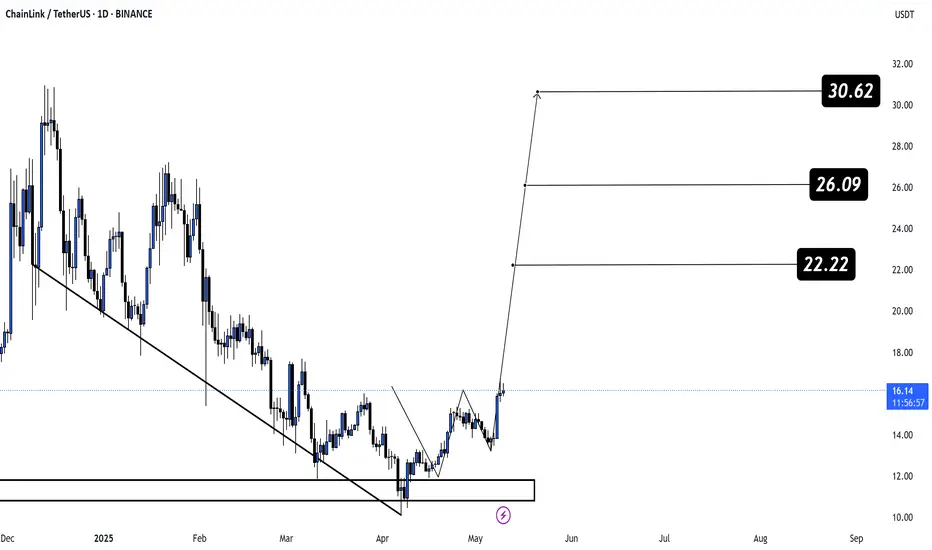
LINK — Time to Load Up!
CRYPTOCAP:LINK has just confirmed a bullish inverse Head & Shoulders breakout and smashed through the crucial $15.5 resistance — the strongest price level since late 2024!💥
This breakout unlocks massive upside potential:
🎯 Target 1: $22.22
🎯 Target 2: $26.09
🎯 Target 3: $30.62
Technicals are aligning for a major trend reversal, and the breakout signals the start of a possible multi-week rally. 🔓📈
Analyzing the trading chart for the LINK/USD perpetual contractAnalyzing the trading chart for the LINK/USD perpetual contract on the Bitget exchange, we can derive some conclusions about the price movement in the short term and suggest trading strategies.
Chart Analysis
Current Price: The current price of LINK is 17.308 USDT, with a volume of 1.28 K contracts traded in the last hour. This indicates moderate trading activity.
Moving Averages:
50-period MA (red line): This moving average is positioned above the current price, suggesting potential resistance and a possible short-term correction.
200-period MA (green line): This moving average is also above the current price, further reinforcing the idea of resistance.
Indicators RSI and MACD:
RSI: With a value of 47.11, the RSI indicates a neutral market condition, suggesting no strong buying or selling signals at this time.
MACD: The MACD lines show some stability, with momentum signals not particularly strong in either direction.
Support and Resistance:
Horizontal lines on the chart indicate various support and resistance levels. The presence of annotations like "BOS" (Break of Structure) and "ChoCH" (Change of Character) suggests that there could be imminent trading opportunities based on price movements.
Trading References
Long Strategy: Consider taking a long position if the price breaks the resistance level around 17.40 USDT. An entry point in this case would be around 17.35 USDT.
Profit Target: Set a profit target at 17.80 USDT, where there are signs of historical resistance.
Stop Loss: Set a stop loss at about 17.00 USDT to limit losses in case of a trend reversal.
Short Strategy: If the price drops below 17.00 USDT, consider a short position.
Entry Point: Wait for confirmation below this level, for example, at 16.90 USDT.
Profit Target: A profit target could be set at 16.50 USDT.
Stop Loss: Set a stop loss at 17.20 USDT to manage risk.
Conclusion
In summary, the chart indicates a neutral market condition with potential movements both upward and downward. Technical indicators and moving averages show significant resistance, while the RSI and MACD do not signal overbought or oversold conditions. Therefore, it is advisable to closely monitor key price levels and adopt both long and short trading strategies based on future movements. Ensure to stay updated on market dynamics and adjust strategies accordingly.

LINKUSDT | Long Bias | Post-Spring Setup | (May 12, 2025)LINKUSDT | Long Bias | Post-Spring Setup + Money Flow Shift | (May 12, 2025)
1️⃣ Short Insight Summary:
Chainlink is completing a corrective phase after a strong three-wave move up. With money outflow showing on the lower timeframes, a pullback toward the $14 zone could offer a solid long re-entry.
2️⃣ Trade Parameters:
Bias: Long
Entry Zone: $14.00
Stop Loss: $12.74
TP1: $15.50
TP2: $69.84
Final TP: $126.26 (longer-term, if trend extends)
Partial Exits: Advised at each TP for safer profit booking, especially at early resistance points
3️⃣ Key Notes:
✅ Money is flowing out on the 1H and 4H charts, suggesting we’re nearing the end of a short-term correction.
✅ Structure looks like a spring setup—ideal for entering on weakness before the next bullish leg.
✅ Already took profits around $16.60 from earlier long exposure—this setup reflects a refined re-entry with lower risk.
✅ $14 zone is a key technical level; will act as a decision point for bulls if defended on volume and reaction.
❌ No reason to chase high entries right now—better to be patient and protect capital.
4️⃣ Optional Follow-up Note:
Will update the idea if LINK reacts sharply at $14 or if larger market shifts invalidate the bias.
Please LIKE 👍, FOLLOW ✅, SHARE 🙌 and COMMENT ✍ if you enjoy this idea! Also share your ideas and charts in the comments section below! This is best way to keep it relevant, support us, keep the content here free and allow the idea to reach as many people as possible.
Disclaimer: This is not financial advice. Always conduct your own research. This content may include enhancements made using AI.

POSSIPBLE BULL SET UP ON LINKUSDTLINK broke out of consolidation phase . IT also broke out of downward counter channel and 15.27 resistance level signaling a potential upward movement. If price eventually break out of the main channel ,the bullish trend will hold.

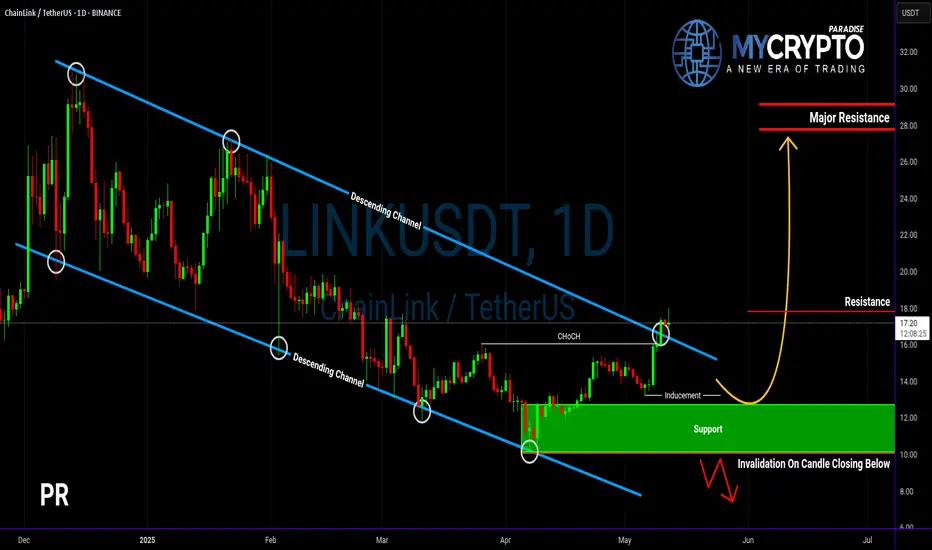
Will LINKUSDT Explode Soon — or Collapse Into a Trap?Yello Paradisers, are you prepared for the next big LINK move? The breakout you’ve been waiting for just happened — but before you jump in, let’s break down what’s really going on behind the chart.
💎LINKUSDT has officially broken out of its descending channel — a significant structural shift that immediately increases the probability of a bullish continuation. On top of that, we’ve seen a bullish CHoCH (Change of Character), a powerful sign that demand is stepping in. These are early but critical signs that bulls may be regaining control.
💎However, experienced traders know not to act on the first sign of strength alone. We now need to see how price behaves on the pullback. If LINK pulls back and takes out the inducement (removing weak hands), we’ll be looking for a bullish internal CHoCH (I-CHoCH) on the 1H timeframe. If that forms, the probability of a solid bounce from the support zone becomes extremely high — giving us the confirmation we need to position for upside.
💎On the other hand, if price breaks down and closes a candle below the support zone, this entire bullish setup becomes invalid. In that case, it would be wise to remain patient and wait for better, more reliable price action to develop before making any move. This is exactly where most traders lose by forcing trades instead of waiting for clear signals.
🎖A big liquidation event, which will first take both longs and shorts and fully get rid of all inexperienced traders before the real move happens, is very close to happening again. so make sure you are playing it safe Paradisers. It will be a huge money-maker for some and a total disaster again for the majority.
MyCryptoParadise
iFeel the success🌴
Daily down trend line just brokeOn the chart it is clear the daily candle is moving around my downward trend line meaning closing above it could lead us to new higher levels.
so here is my strategy for trade:
the price is moving into my base area trying to close above the daily trend line. if those conditions hold, then we can find proper entry for long position in lower time frames.
the first important level would be around 19.5$, breaking this level will lead us to upper levels. so if you eager to long this coin you can follow me and my next updates.
Enjoy the market

Chainlink Price - 12/May/2025Chanilink price has broken the Equal High Zone at 17.5$. It will retest to Order block zone (15.4$ - 15.8$) and need to break EQH ( 17.5$) again, before it visit next Equal High at 19$ zone.
Keep our eye on it. Long term focus is 100$ per coin #Chanilink #Topdifi
