Will this breakout unlock 17% gains toward the $16 target?Hello, ✌
All previous targets were nailed ✅! Now, let’s dive into a full analysis of the upcoming price potential for Chain LINK 🔍📈.
BINANCE:LINKUSDT is currently testing the psychological daily resistance zone around the $14.00 level. A confirmed breakout above this area could open the way for a potential upside move of roughly 17%, with the next key target around $16.00. Price action near this zone should be watched closely for either rejection or continuation. 🚀📈
✨ Need a little love!
We put so much love and time into bringing you useful content & your support truly keeps us going. don’t be shy—drop a comment below. We’d love to hear from you! 💛
Big thanks, Mad Whale 🐋
LINKUSDT trade ideas

LINK Weekly – Double Bottom Confirmed
LINK on the weekly has confirmed a double bottom formation right at the 0.786 Fib level.
Remember, this Fib level is the last major support — so price is basically at bottom levels.
Last week closed above the weekly 200MA.
The next resistance zone is the BB center line and the 50MA.
If price clears this zone, it could push toward the 0.618 Fib level.
Always take profits and manage risk.
Interaction is welcome.

That's why everyone should have LINK⚡️ Hello, everyone! I decided to continue exploring fundamental altcoins. Next up is LINK. This is definitely a key project in terms of technology, and without it, the crypto ecosystem we know today would not exist. Their oracle technology is used by approximately 90% of ALL protocols.
So it's hard to underestimate its importance, but let's take a look from a technical point of view. How much trading potential does LINK have?
➡️ The token has been in correction for a long time, like practically the entire market. During the decline, it formed a GAP at the level of $25.65 - $20.55. And as we know, 95% of GAPs tend to close sooner or later.
Globally and locally, the token is currently in a flag pattern. Therefore, high volatility and a period of consolidation can be expected in the near future. During this period, the further direction of the token's movement will become clear.
⚙️ Metrics and Indicators:
Volume - a divergence with the price has formed. Throughout the correction, sales volumes have decreased. This signals the exhaustion of sellers.
Money Flow - harmony with the price. Liquidity continues to slowly decline, but at the same time, it does not form new lows, which means that demand for the token remains.
Support/Resistance - LINK has now reached a key level at $12.64, which could trigger a surge in buyer interest. However, if it cannot hold, the next strong support is at $10.09. At the same time, slightly higher, at $15.52, there is strong resistance, which is also a strong psychological resistance (round number).
📌 Conclusion:
LINK certainly still has potential for decline. It is quite undervalued, even with Bitcoin being so expensive. But if Bitcoin falls, LINK will fall even lower, as will the entire market.
And at times like these, everyone's attention turns first to fundamental assets that are truly valuable and currently too cheap. No one is rushing to buy HarryPotterObamaSonicInu10 because no one knows its true value.
🔥 So be patient, LINK is definitely a fundamental asset, and if you want to add it to your portfolio, now is definitely not the time.

Link 26X Next Bull RunChainLink
Chainlink is the platform that connects real-world data, governments, enterprise systems, and thousands of blockchains into unified applications .
It is considered one of the strongest currencies in the market, and will achieve very high numbers in the future. We note that the currency is following an upward trend. Any positive market movement will see this currency rise sharply.
I wish everyone abundant profits.
Like and follow
for more.

Chainlink (LINK): Looking For Proper MSB (market structure breakChainlink struggled to break the local 200EMA line, where the price is hovering between the support area at $12.83 and the 200EMA line.
Nevertheless, we are still seeing the demand for breakout so we are expecting to see some sort of buyside movement with proper MSB, which would back our trade idea.
Swallow Academy

LINKChainlink has a target of $62 once it breaks above the resistance line. The Chainlink CEO is very active in the space and continues to add more utility to the project.

Chainlink (LINK): Possible Buying OpportunityChainlink has had a smaller bounce since last time, when sellers then took over the area and led the price back to the local support area.
Now price is showing yet again some kind of bullish volume, which might give us another opportunity for upward movement from here.
Swallow Academy

Chainlink, The Fed, Vanguard, Crypto & Apple"Buy the rumor, sell the fact." The market tends to price-in an event before it happens. I am talking about the reduction in interest rates. The participants are aware that there will be a reduction in interest rates by the Fed and this is bullish and so buying starts to happen much sooner compared to the announcement of the actual event. By the time the event becomes a reality, it is already priced-in. Meaning...
Chainlink is bullish now and the chart is the same as HIVEUSDT, which I shared just now, and many other altcoins. This is good because we know what happens next. If there are other pairs with the same chart but moving up, moving ahead, then we know that these two and all those other staying behind will also follow, makes sense? Sure it does. We are all one. What one does, the rest follows.
Chainlink (LINKUSDT) is set to grow. Easy to see, higher highs and higher lows.
Will the market go up because of the Fed? We can say so before or after the event, right now the only important action is to buy-and-hold. It is important to be fully invested in Crypto, because Crypto is outperforming every other risk-asset in the entire world. You want be in in the market that is about to pay. You don't want to be holding bonds or index funds, that's a huge mistake. You buy these stuff to make money, you can make with Crypto in 6 months what an index fund (Vanguard SPX) will pay in a decade... Do the math, are you a young adult, are you smart? If you are, take action now before it is too late.
Your choice of course. Imagine the people in the 80s investing in Gold rather than Google, Microsoft and Apple... Big mistake.
Namaste.

LINK - Clear Price Action on the Bull Side.Chainlink (LINK) shows strong bullish potential for a swing trade. However, it’s likely to first dip to clear out liquidity at lower levels. Look for a bullish Market Structure Shift (MSS) on the lower timeframe (LTF) to confirm the start of an upward move.
Remember, do not guess. Prepare and React.
Confidence comes from Clarity, not Hope.

Chainlink (LINK): Looking For Bounce From HereChainlink has reached the lower side of the local bullish trend, where we might be seeing some good upward movement very soon. We are looking for proper bounce and break of structure on smaller timeframes like 5M or 10M, after which we would be looking for a long here.
Swallow Academy

Link Bullmarket?-Overall Bullisch Structure
-VPOC Retest
-Impulse That broke Daily Structure
-WXY that hits the Prime Target followed
by an aggresive Bullmometum that Breaks 4h Structure
-11,50 should told to taget 1)20, 2)26, 3)47
NFA

LINKUSDT 1D#LINK has formed a bullish flag on the daily chart.
In case of a breakout above the flag resistance and the daily MA100, the targets are:
🎯 $14.88
🎯 $15.81
🎯 $17.13
🎯 $18.82
⚠️ Always use a tight stop-loss to manage risk and protect your capital.

Chainlink (LINK): Possible Reclaim of Bearish CMESellers are showing strong dominance where recently we had broken and secured the 200EMA line and also reached one of our targets on other analysis from last week.
We are now looking and aiming at that bearish CME gap where we might be seeing some sort of sideways movement to form and eventually an MSB with price movement towards the bullish CME—so for now we want to see more downward movement and once we are down, then we get back to Chainlink!
Swallow Academy

LINk/USDTFor the Link currency, I feel that this decline is continuing and it is continuing to decline step by step. The chart was not readable. Tell me your opinion.

Link targets for august 🔥 BIST:LINK long setup (1 D) 🚀
✅ Entry Zone: $10.50 – $11.80 (18-month demand)
🎯 Targets
• TP-1: $19.50 (Dec-23 supply flip)
• TP-2: $26.00 (Apr-24 breakdown block)
⛔ Stop-Loss
Daily close < $9.40
📊 Thesis
• #CCIP live on 8 L1/L2s; Swift + 10 banks pilot tokenization via CCIP 🏦
• #Staking v0.2 (45 M LINK) secures Data Streams & CCIP 🔒
• Q1-25 product update: Data Streams + Functions → #mainnet for DeFi ⚡
• #Hong Kong CBDC swap & #ANZ stable-coin tests run on CCIP 🌐
• $260 T #untokenized assets addressable; BlackRock tokenized fund cites Chainlink 🏛️
• 55 % circulating LINK locked in staking or DeFi; supply inflation 0 % 🟢

$LINK | Higher Timeframe LONG SetupThe falling wedge pattern visible on the chart has broken to the upside — a historically bullish formation that often signals a reversal. However, it’s important to note that price has not yet reclaimed the EMAs.
📌 The key invalidation level is below the April 7 wick.
As long as there is no candle close below that level, the setup remains valid. A close below would invalidate the wedge structure.
Currently, price is entering a buy block zone, which has previously shown strong demand. A reaction from this region — especially if it pushes price back above the EMAs — would increase confidence in the setup.
🎯 Target zone: 23 – 30 USDT
🛡️ Stop loss: 10.09 USDT
📈 Risk/Reward: High potential
⚠️ This is not financial advice. Always manage your own risk accordingly.
#LINK #Chainlink #LINKUSDT #CryptoTrading #PriceAction #TradingView #Altcoins

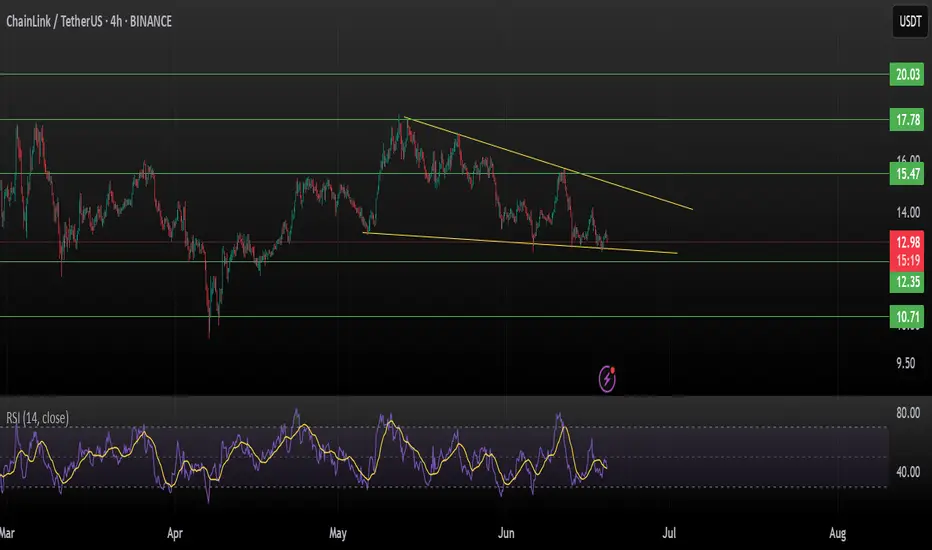
Chainlink (LINKUSDT) | Falling Wedge at Critical SupportChainlink is trading within a well-defined falling wedge pattern on the 4H chart, a typically bullish reversal setup. Price action indicates the coin is hovering just above key horizontal support around $12.35, making this a critical zone to watch.
Technical Breakdown:
Pattern: Falling Wedge (Bullish Bias)
Current Price: $12.98
Immediate Support: $12.35
Major Support: $10.71
Resistance 1: $13.80 (wedge upper trendline)
Breakout Targets:
$17.78 (major resistance)
$20.03 (macro level supply zone)
Indicators:
RSI (14) at ~42 → Weak but stabilizing, potential for reversal
Volume has been compressing — watch for a breakout with rising volume for confirmation
Strategy:
A 4H close above the wedge trendline with volume could trigger a breakout rally toward $17.78 or even $20.03.
Failure to hold $12.35 could send LINK back toward $10.71 support, caution below this level.
Setup Summary:
Long entry on breakout above $13.50 (trendline)
Stop-loss: Below $12.35
Target 1: $17.78
Target 2: $20.03
Risk: Reward Ratio: ~1:3+
Not financial advice. DYOR before entering trades.
If this analysis helps, like & comment your view.
LinkEntry price yellow line
Stop loss update from red line to yellow line
We hit first Take profit
I Close full now

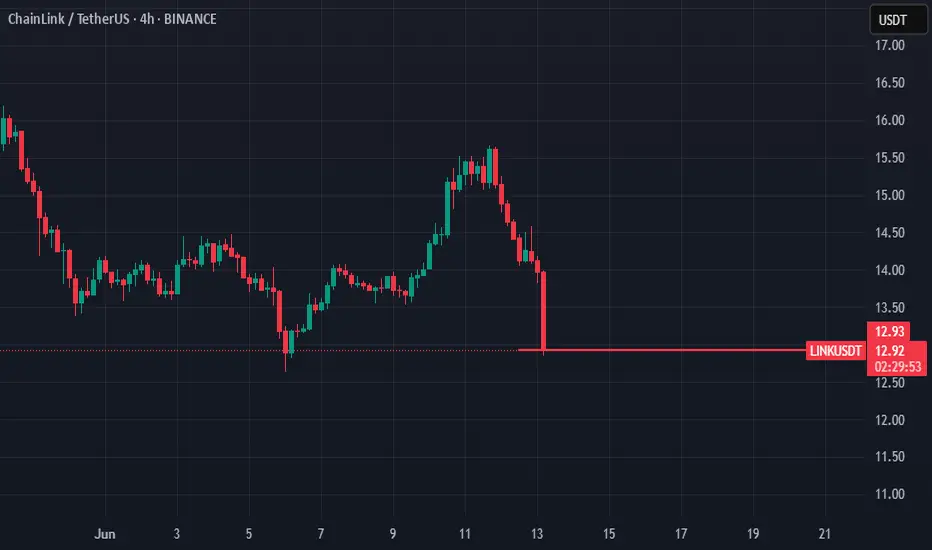
Chainlink Price on 14/June/2025Chainlink is trading at 13.25$ as of 14/June/2025. In Next week, It need to retest at 12.4$ -12.6$ before it break 15.51$. To claim the bull the price should be 20$.


linkusdt is in pumping conditionlink can break daily resistance. can good give profits in upcoming market conditions

Weekly trading plan for LINKLink has already reached his 3rd target of the week. The chart shows divergence, but now the price above the monthly pivot point and there is a chance to see a continuation of growth. If it returns under monthly PP we may see a local correction or a deeper one to the weekly PP level
Write a comment with your coins & hit the like button and I will make an analysis for you
The author's opinion may differ from yours,
Consider your risks.
Wish you successful trades ! mura
