LINK: up-trend📊Analysis by AhmadArz:
This chart shows the ChainLink (LINKUSDT) pair on a 4-hour timeframe. The analysis is as follows:
1. Support and Resistance Levels:**
-Resistance:** $17.417, $18.999, and $21.328.
-Support:** $14.356 and $12.818.
2. Trading Strategy:
-Wait for Pullback:** The price might drop to the support level of $14.356.
-Enter Buy Trade:** After the pullback, entering at $14.356 is suggested.
3.Overall Trend:** Uptrend with typical fluctuations. If resistance levels are broken, higher price targets are possible.
In summary, wait for a price correction and enter buy trades at support levels.
🔗"Uncover new opportunities in the world of cryptocurrencies with AhmadArz.
💡Join us on TradingView and expand your investment knowledge with our five years of experience in financial markets."
🚀Please boost and💬 comment to share your thoughts with us!
LINKUSDT trade ideas

ChainLink Update: Correction about to happen, Overall Bullish!ChainLink is forming a clean H&S pattern on the daily and weekly charts, which can cause the price to experience a correction to lower levels at $7.7, the main support to hold before starting the big move along with the whole market in the upcoming bull market. The main targets are at $36 and $96, IMO. DYOR

#LINK/USDT
#LINK
We have a descending channel pattern on the 4-hour frame, the price is moving inside it and adhering to its borders well
We have a support area in green at a price of 13.00 after the price touched it and rebounded from it
We have a trend to stabilize above the moving average of 100
We have a downtrend on the RSI indicator that supports the price upwards
Entry price 14.00
First target 15.90
Second target 17.00
Third target 18.55

Chainlink to sink 50%On the above weekly chart price action has rallied 300% from the lows. A number of reasons now exist to exit long positions. They include:
1) Support and resistance. Ever since price action broke market structure (look left) price action has been in a downtrend. At this time price action climbs to the broken structure area and finds resistance.
2) A weekly bearish engulfing candle prints at resistance.
3) Bearish divergence. A higher high in price action is met with a lower high in RSI.
4) Past resistance is yet to confirm as support before higher highs print. That resistance is around $8 or a 50% correction from current levels.
Ww

LINKUSDTLINKUSDT.
Will ALICEUSDT get bids from buyers ?
As the price is at strong support level and bullish divergence indicating the buyers may attack this zone. If this happens and buyers start buying from here then the next target could be 20.
What you guys think of this idea.

LINK - Ending DiagonalBIST:LINK - Possible Ending Diagonal
These moves usually imply a "Dramatic Reversal Ahead"

LET'S LINK THE CHAIN Hello Traders and everyone, I am Hadi Karaali, Known as SNIPERS_FX
If you like the idea, do not forget to support with a like and follow.
LET'S LINK THE CHAIN. 📚
👉Price is sitting around our lower bound and previous major lows, acting as a massive support zone.
👉Meanwhile, we can start looking for new longs around our lower bound marked zone, for new longs from a short-term perspective, Adding on, if the price managed to break above the upper marked zone, then a movement higher would be expected from a medium term perspective.
If you like this kind of analysis don't forget to like and follow
and as usual follow your trading plan and manage your risk.
Be patient and good luck!

Link Technical AnalysisLink is currently holding on a support zone (Green) at $12.563 - $13.003. This zone has historically provided a solid foundation for the price to rebound. If the price holds above this support, we could see a potential rise toward the next resistance zone (Yellow) at $17.388 - $18.471. However, if the price breaks below the green zone, it might drop to the next significant support zone around $8.709 - $9.748. Traders should keep a close eye on how the price behaves around these key levels, as they will provide important clues about the market's next direction. Watching for increased trading volume and strong price movements can help identify whether the price is likely to bounce back or continue to fall.

CHAINLINK AT MAJOR SUPPORTWe have came down to a massive support level and I expect to see a reaction at this level leading to a bounce higher.
Lets see how this all plays out.
Calculate Your Risk/Reward so you don't lose more than 1% of your account per trade.
Every day the charts provide new information. You have to adjust or get REKT.
Love it or hate it, hit that thumbs up and share your thoughts below!
This is not financial advice. This is for educational purposes only.

LINK ANALYSIS🚀#LINK Analysis : What Next ??💲💲
✅As we can see that there was a formation of "FALLING WEDGE PATTERN" in #LINK and given a breakdown. We are expecting a little retest towards support level and then a bullish move📈
🔰Current Price: $13.455
🎯 Target Price: $19.227
⚡️What to do ?
👀Keep an eye on #LINK price action. We can trade according to the chart and make some profits. Stay tuned for further analysis and stay updated with market sentiments and news.⚡️⚡️
#LINK #Cryptocurrency #TechnicalAnalysis #DYOR

Chainlink (LINK): Neckline Zone Is Being Tested / H&S PatternChainlink caught our attention with one choppy head and shoulder pattern where the right shoulder has deformed and is now back at the neckline zone, looking for a final confirmation of local breakdown.
Odds are pretty good so now we keep an eye on that neckline zone to be broken!!
Swallow Team
Link #LINK #ScalpBased on the bullish divergence in LINK, I am considering a long position at the current level for a quick profit.

LINK - EWT Ending Diagonal WaveBIST:LINK
Elliott's Wave - Ending Diagonal Wave w/Converging Lines
Price Action is currently printing a textbook Ending Diagonal Wave within a corrective 5th wave w/decreasing volume from $19
All while overextended into heavy support and nearing rising support with Bullish Divergences on RSI and OBV
What will you do with this information...?

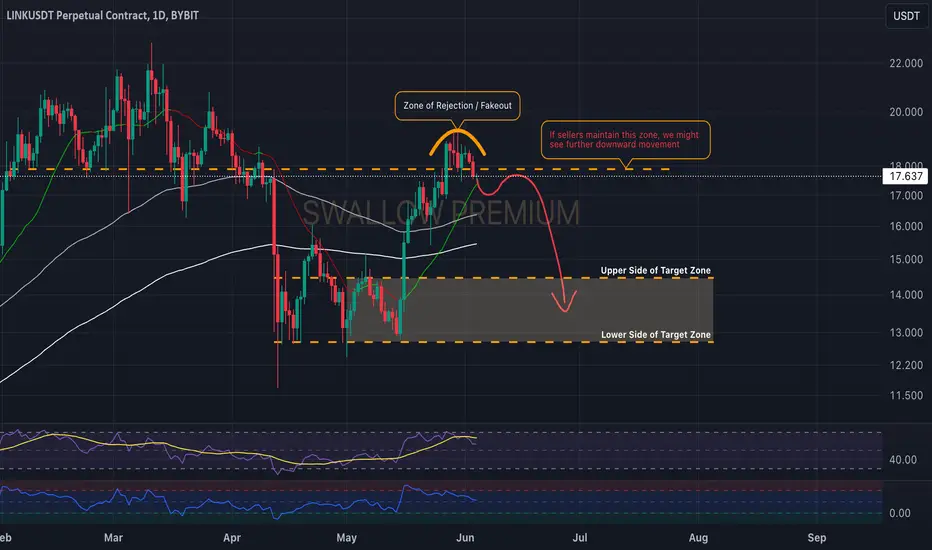
Chainlink (LINK): Re-Test And Movement To Lower Support Zone!Chainlink had made a small fakeout, attempting to breakout from local resistance zone.
While price is now back below that zone, it is not yet secured, so we are waiting for further confirmation here (in the form of re-test).
Swallow Team
CHAINLINK TOO DECISIVE - PICK YOUR POSISON - WAIT OR JOIN?
BINANCE:LINKUSDT chart is so clean and self explanatory. We are either in some kind of larger degree wave 2-yellow or wave 5-orange as depicted on the side. If you're bearish you invalidation level is just the previous swing high. Bullish? you invalidation level is the previous swing low. The question is which side will be taken first? are you going to wait or join?
OTHER ANALYSIS
OKX:CFGUSDT
BINANCE:APEUSDT
BINANCE:ARBUSDT
BINANCE:ALGOUSDT
BINANCE:ADAUSDT
BINANCE:PIXELUSDT

LINK - Perfect Bounce ZoneBeautiful Topping Pattern ->
-> Perfect EWT 5 Count Down ->
-> Topping Signal Inverted @ Bottom ->
-> Volume Reclamation Of Heavy Support ->
-> Bullish CPI + PPI Data ->
-> = Perfect Bounce Zone

Lingrid | LINKUSDT approaching BUYING areaBINANCE:LINKUSDT price plummeted in tandem with the BTC price action, before pulling back towards its support level following a bullish extension. As we can see, the price is approaching the buying area between $13.00 and $15.00, where it's currently trading sideways. I think it's likely that the price will retest the local lows, potentially forming a double bottom pattern, which would be a bullish sign. There appears to be accumulation taking place in the $13.00-$15.00 price zone. I expect the price to react to the lower border of the channel by bouncing off and initiating an upward move.
Traders, if you liked this idea or if you have your own opinion about it, write in the comments. I will be glad 👩💻

LINKUSDT 1D#LINK is moving inside a descending channel. Currently, it has bounced off the middle line of the channel. It has broken above the daily MA50 and is now facing the MA100. Overall, the structure is bullish. The targets are:
$18.332
$20.354
$22.375
$25.253

Link - bounce from previous range 618 level (14.6)Link on 4h chart has made a support / resistance flip - a lower range to a higher range. Now that support is being tested as price is falling with the market conditions.
I see heavy confluence around the key level of 14.6 with a golden pocket 618 + a 6.1M bullish breaker + range value area high. Anything can happen.
I suspect we find support soon.
I strongly believe Link is the one token to rule them all in all of the crypto narrative when it comes to usecase.
Not ever Financial Advice.
paper trading only.

$link long btc has reached 66k support , if we hold this level i expect alt coins to recover after dumping for three weeks straight

LINKUSD Elliott wave countBelow 19.241 we are looking to the downside to complete wave (y) from a a complex correction wave ((ii)).
Possible target 0.50-0.618 fib retracement of wave ((i)).
Also we have 9.831 price level for equality between waves (w) and (y).

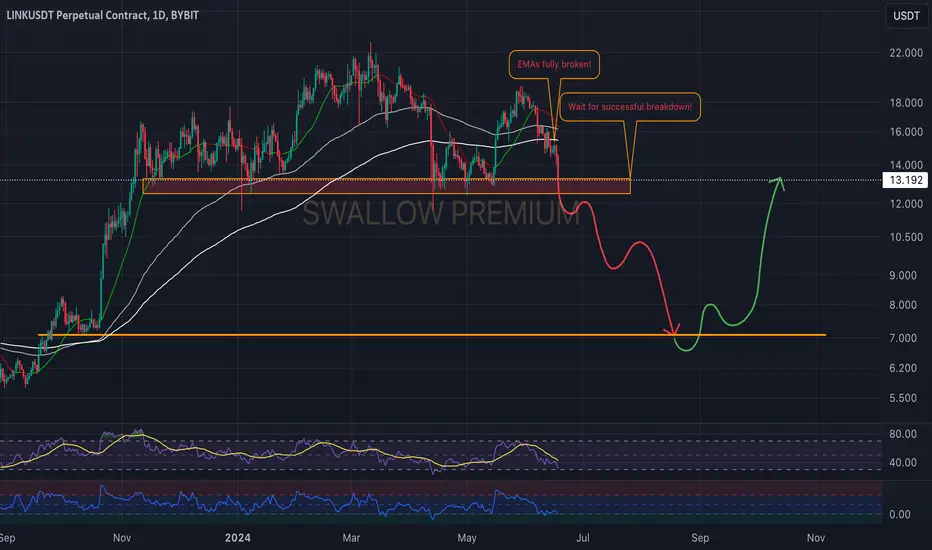
Chainlink (LINK): About To Break 200 EMA Chainlink has made a really nice movement after rejecting that upper resistance zone. At the moment, price is testing the 200 EMA line, which we see to be broken anytime now.
Once we see the breakdown from there, a movement to our target zone should start!
Swallow Team

LINKUSDTHi guys
It seems that we have an upward channelized trend. And currently, the ceiling of the RSI negative divergence channel has also been issued.
The support area of $17.24 is still preserved.
Provided that this support area and the upward trend line are maintained, there is a high possibility of forming an upward trend similar to the drawn upward scenario.
in case of breaking the upward trend line and losing the support range of $17.24; The downside scenario is more likely.
What do you think?
