LISTAUSDT trade ideas
$lista ready to fly?Lista DAO’s 3.65% 24-hour price rise appears driven by a major exchange listing, bullish technical momentum, and strategic ecosystem developments.
Bithumb listing (24 July) boosted accessibility for South Korean traders.
Technical indicators show bullish momentum above key moving averages.
Partnerships with NanoLabs and protocol upgrades enhanced investor confidence.
#LISTA/USDT#LISTA
The price is moving within a descending channel on the 1-hour frame, adhering well to it, and is heading for a strong breakout and retest.
We are seeing a bounce from the lower boundary of the descending channel, which is support at 0.1970.
We have a downtrend on the RSI indicator that is about to be broken and retested, supporting the upward trend.
We are looking for stability above the 100 Moving Average.
Entry price: 0.1982
First target: 0.2097
Second target: 0.2133
Third target: 0.2273

LISTAUSDT Forming Falling WedgeLISTAUSDT is setting up a promising technical scenario with its clear falling wedge pattern, a structure known for signaling bullish reversals after a period of consolidation. The wedge is narrowing nicely, suggesting that selling momentum is weakening while buying pressure is starting to build. With good volume supporting this move, the breakout potential looks strong, and the chart indicates an expected gain in the range of 70% to 80%+ if the pattern plays out as anticipated.
Lista is garnering more attention among crypto traders and investors due to its innovative approach and growing ecosystem. The increased investor interest is reflected in recent volume spikes and price action, both of which indicate that a breakout above the wedge’s resistance trendline could see strong follow-through buying. For traders, this pattern combined with solid fundamentals creates a compelling opportunity to watch closely for confirmation.
From a broader market perspective, the overall sentiment in altcoins and emerging crypto projects is showing signs of revival. This macro environment can provide an additional tailwind for LISTAUSDT, boosting the chances of the pattern delivering its full upside target. Keep an eye on key support and resistance levels, as a decisive daily close above the wedge could unlock further momentum.
If you’re trading or investing in LISTAUSDT, risk management remains critical. A clear invalidation level below the wedge support will help protect capital if the market moves against the setup. Stay tuned to price action and volume for confirmation of this high-probability breakout opportunity.
✅ Show your support by hitting the like button and
✅ Leaving a comment below! (What is You opinion about this Coin)
Your feedback and engagement keep me inspired to share more insightful market analysis with you!

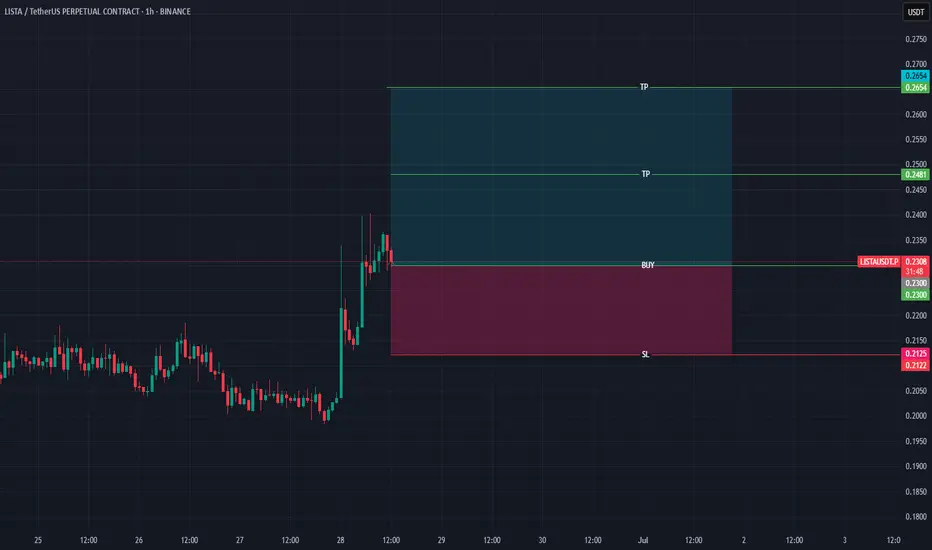
Lista DAO: 100% & 346% TargetsAnother interesting chart here, the candles might seen small but LISTAUSDT produced more than 200% between April and May, and it is ready to move again.
The action is happening now as a strong higher low and buy-volume has been really hiiiiigh lately going up, up, up. This type of chart supports a continuation, a new bullish move prices produce profits easy buy and hold.
I used this pair for a short-term trade because the chart is young. I am using the young charts for the short-term trades and the old charts for the long-term ones. Of course, there can be old projects with short-term trades but there can't be new projects with long-term numbers because data is missing from the chart.
To play it safe, we can predict easily where prices are headed next but a new project won't reveal its potential for the 2025/26 new all-time high, it is a hard, data-missing guess.
Lista DAO looks ready for another wave. The first support is set at 0.1692, the previous higher low and the first target is set at 0.4624 for 100% growth. The main target is 1.03 and this reaches a nice 346%. By the time the bull market ends, there can be more.
This is a strong chart setup because of the volume and the strong higher low. I wouldn't want to miss this one.
Namaste.

LISTAUSDT 1D#LISTA — Breakout Brewing? ⏳
#LISTA is currently trading inside a symmetrical triangle on the daily chart — a potential consolidation before a move.
🟢 Buy zone: Near the support level at $0.2177 and the daily EMA100
A bounce from this level could lead to a strong bullish breakout.
If a breakout occurs, watch these targets:
🎯 $0.3119
🎯 $0.3723
🎯 $0.4326
🎯 $0.5186
🎯 $0.6281
⚠️ Always use a tight stop-loss to manage risk and protect your capital.

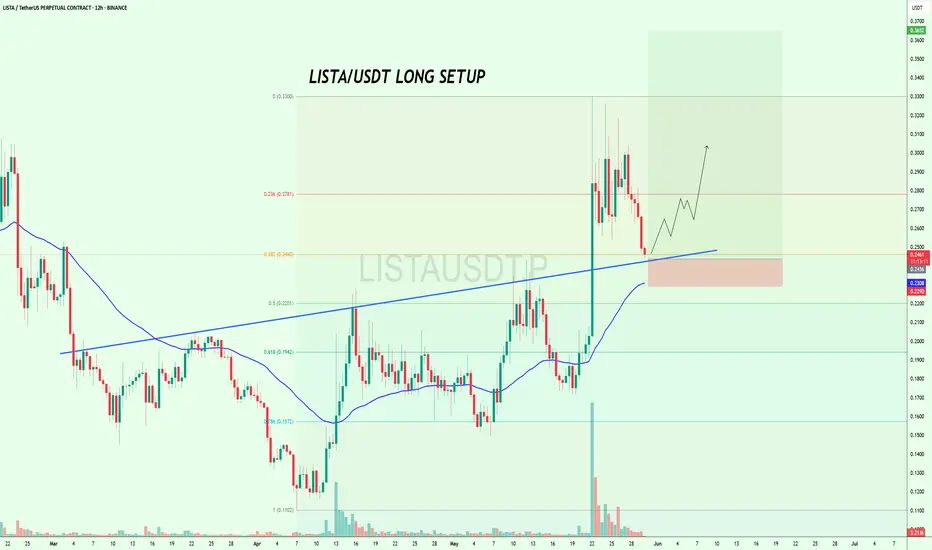
$LISTA at Key Support – Long Opportunity Loading?$LISTA looks good to long here with a short SL🚀
It is approaching a key confluence support zone right at the 0.382 Fib level (~0.2460), the rising trendline, and the 100EMA on the 12H chart.
This level held well in the last move and could once again act as the launchpad for a bullish breakout toward $0.30–$0.33.
But if it breaks below this support zone, short-term momentum could shift.
Watch how the price reacts here👀
BINANCE:LISTAUSDT
LISTA – Long Position IdeaThis setup is based on my Fibbo Time Levels strategy, showing a bullish signal aligned with a key time-based reversal point. Market structure and timing suggest a potential upward move.
📌 Timeframe: 15M
🎯 Target & SL: Marked on chart
⏳ Confidence: Confirmed by Fibbo timing alignment
Watch for follow-through as price reacts to the cycle.
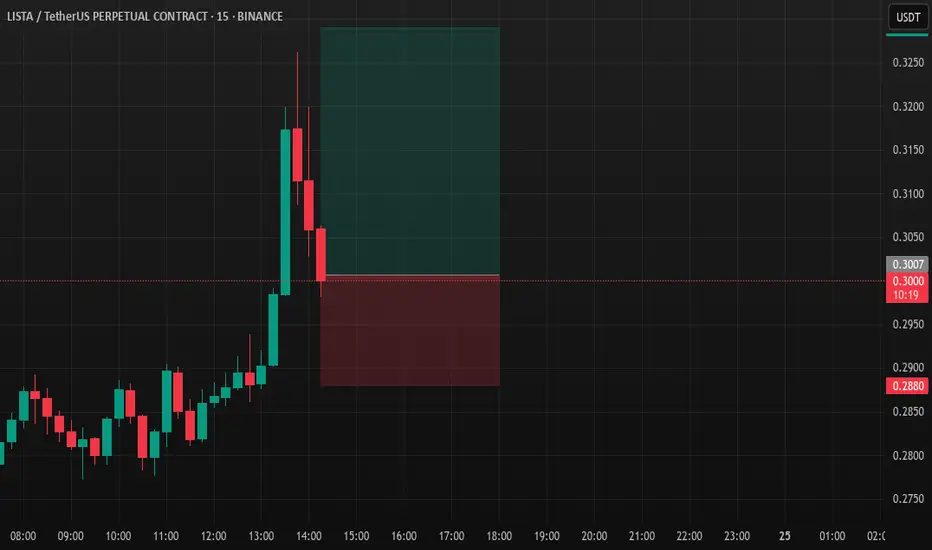
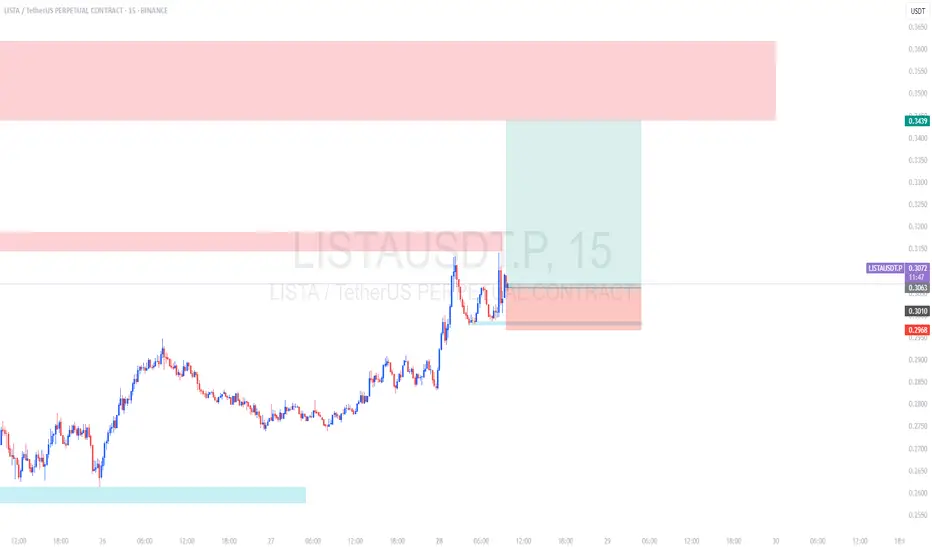
LISTA Looks Bullish (1D)It appears that wave C of a complex correction has completed. The price has reclaimed key levels and consolidated above them.
Also, if you look closely at the chart, you can spot a bullish Quasimodo (QM) pattern forming.
The price is expected to move from the green zones toward the red zones.
A daily candle closing below the invalidation level will invalidate this analysis.
For risk management, please don't forget stop loss and capital management
Comment if you have any questions
Thank You

LISTAUSDT 1D AnalysisLISTA ~ 1D Analysis
#LISTA Buy gradually from here if you still have confidence in this coin with a short term target of at least 10%++ from here

LISTA potential gain 10-50%Buy gradually from here or wait for breaking through this resistance line with a short-term target of at least 10%+.

#LISTA/USDT#LISTA
The price is moving within a descending channel on the 1-hour frame, adhering well to it, and is heading for a strong breakout and retest.
We are seeing a bounce from the lower boundary of the descending channel, which is support at 0.1596.
We have a downtrend on the RSI indicator that is about to be broken and retested, supporting the upward trend.
We are looking for stability above the 100 Moving Average.
Entry price: 0.1632
First target: 0.1715
Second target: 0.1764
Third target: 0.1908

LISTAUSDT UPDATELISTAUSDT Technical Setup
Pattern: Falling Wedge Breakout
Current Price: $0.1893
Target Price: $0.30
Target % Gain: 60.04%
Technical Analysis: LISTA has broken out of a falling wedge pattern on the 12H chart with increasing momentum. Price is holding above the breakout trendline, suggesting bullish continuation. A confirmed breakout with volume could push price to the projected target.
Time Frame: 12H
Risk Management Tip: Always use proper risk management.

LISTAUSDT 1D AnalysisLISTA ~ 1D Analysis
#LISTA Buy back from here with a short -term target of at least 10%+ from here.

LISTAUSDT 1DLISTA ~ 1D Analysis
#LISTA Buy after successfully penetrating this resistant line with a short -term target of at least 10%+.

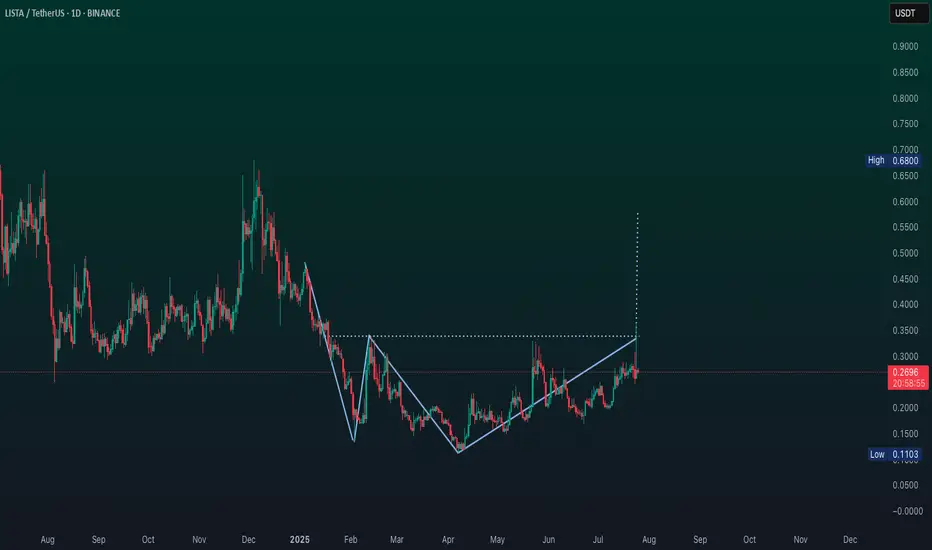
Lista DAO: Bullish Sequence, Bullish Market, Bullish Confirmed The action present on this chart confirms the bullish bias which is now present within the Altcoins market. The low/bottom was set in early February, on the third.
Notice first the very strong downtrend marked here with a black line.
We are looking at LISTAUSDT on the daily timeframe.
The day the down-trendline is broken LISTAUSDT produces the highest bullish volume day ever. So lots of buying happened to switch from bearish to bullish.
The initial bullish breakout, which is the first bullish jump after the bottom is in, tends to go into retrace immediately after showing up. This is standard price action. If the market is set to go bullish and continue bullish, this retrace tends to end in a higher low. This is exactly what we see on this chart. HL = Higher Low.
The higher low will lead to a bullish wave and the bullish wave will lead to higher and higher and higher prices.
Thank you for reading.
Namaste.

LISTA LONG !!!!#LISTA/USDT
Entry zone : 0.248214 - 0.2649338
Targets : 0.2675176 - 0.2728150 - 0.2781124 - 0.2834098 - 0.2887072 - 0.2940045 - 0.2993019 - 0.3045993
Stop loss :0.2189

LISTAUSDT: Falling Wedge Breakout – 100%-120% Gains on the Way!LISTAUSDT has recently broken out from a Falling Wedge pattern, signaling a bullish shift in market sentiment. The Falling Wedge is a well-known chart pattern that typically suggests a consolidation phase before a breakout, where the price forms lower highs and higher lows, converging towards the apex. With the breakout now completed, the price action indicates that the market is ready for a strong move to the upside. The breakout has already caught the attention of investors, and with good volume backing the move, there is a strong expectation for a continuation of the rally. Traders are forecasting potential gains of 100% to 120%+ as the price moves toward new highs.
The breakout from the Falling Wedge pattern is a key technical indicator that confirms the start of an upward trend. The good volume accompanying this breakout shows that the market is reacting positively, and the buying pressure is expected to increase as more traders recognize the opportunity. Falling Wedge patterns typically lead to strong momentum once the price breaks through the upper trendline, and with the current volume supporting this move, LISTAUSDT has the potential to see significant gains in the near future. The projected target of 100% to 120%+ aligns with the breakout's momentum, making this an exciting setup for traders looking for high-reward opportunities.
Investor interest in LISTAUSDT is growing as more market participants see the breakout and the potential for substantial returns. The combination of a solid technical pattern, strong volume, and an increasing number of investors taking interest in the project makes LISTAUSDT a promising asset in the crypto space. If the price continues to hold above the breakout level and breaks through further resistance, the move could accelerate, leading to a significant price increase. As the bullish momentum builds, the potential for higher gains increases, further fueling investor confidence.
Traders should stay vigilant and monitor key levels of support and resistance to confirm the strength of the breakout and the likelihood of continued gains. If LISTAUSDT continues to show strong price action and buying interest, the projected 100% to 120%+ gain could be realized, offering significant returns for those positioned correctly. The current technical setup and increasing investor participation make LISTAUSDT one of the top crypto pairs to watch for potential high returns.
✅ Show your support by hitting the like button and
✅ Leaving a comment below!
Your feedback and engagement keep me inspired to share more insightful market analysis with you!

Lista? Ready?Well just want to see what it follows? sentiment or reaction, eitherways sentiment is orange, reaction is blue

LISTSUSDT - HUGE UPSIDE 🚀 ** BINANCE:LISTAUSDT : Huge Upside Potential IF We All Play Ball!** 🚀
Hey #CryptoFam, let’s talk about ** BINANCE:LISTAUSDT **! This coin has **MASSIVE upside potential**, but here’s the deal: **it needs the rest of the market to play ball** 🏀.
When **BTC**, **ETH**, **XRP**, and other majors start running, altcoins like BINANCE:LISTAUSDT can absolutely **explode**. We’ve seen it happen before—altseason pumps are REAL, and BINANCE:LISTAUSDT could be one of the biggest winners if the market aligns.
**Why BINANCE:LISTAUSDT ?**
- **Undervalued gem** with strong fundamentals.
- **Low market cap** = high potential for parabolic moves.
- **Community-driven** projects like this thrive when the market heats up.
But here’s the thing: **We need BTC and ETH to lead the charge**. Once the big boys start moving, alts like BINANCE:LISTAUSDT will follow. If you’re holding or watching this one, keep an eye on the broader market. When BTC breaks out, BINANCE:LISTAUSDT could **10x or more** 🚀.
**What’s the play?**
- **DCA in now** while it’s still under the radar.
- **Watch BTC and ETH** for signs of a breakout.
- **Be ready to ride the wave** when altseason kicks in.
Let’s get this bread, fam! 🍞 If we all play ball, BINANCE:LISTAUSDT could be the next big mover. **LFG!** 💥
#Crypto #Altseason #LISTAUSDT #BTC #ETH #XRP #Alts #ToTheMoon

LISTAUSDT(ListaDAO) Updated till 10-02-25LISTAUSDT(ListaDAO) Daily timeframe range. 0.1679 defended well for now it is local low. now a healthy close above 0.2605 can push it to 0.3433. market retrace or money comes to this alt 0.1679 level actually can provide good R:R setup.

LISTA/USDT 1. The power reserve is okay.
2. The level is clean and clear.
3. Good accumulation above the level.
