Litecoin on the Verge of a Breakout: Are You Ready for a Rally?Hello, Traders!
After reaching a local high last month, Litecoin entered a correction phase but is now showing signs of recovery.
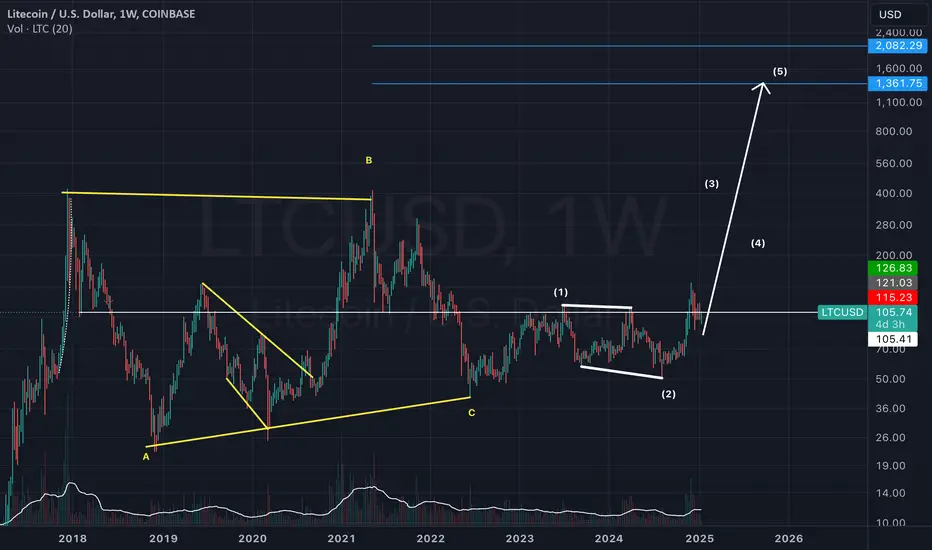
A few days ago, LTC came close to retesting its previous local high before undergoing a minor pullback.
Currently, it appears that LTC has found strong support in the $95-$100 range, forming a local bottom. I don’t expect the price to dip below this area.
On the upside, there’s a clear resistance zone in the $135-$145 range, which has been tested twice but not yet broken.
The price action suggests that Litecoin is building momentum for a breakout above this level.
If this breakout occurs, it could serve as a catalyst for a parabolic rally.
In such a scenario, the next target will likely be the $200 price level, which aligns with the psychological round number.
Beyond $200, further upside targets could emerge depending on market conditions, particularly if broader market sentiment remains bullish.
Traders should watch for confirmation of the breakout above $145, accompanied by strong volume, as this will increase the likelihood of sustained upward movement
Please don’t forget to boost this idea and leave your comments below.
LITECOIN trade ideas

Inverse Head and ShouldersOn the weekly, we have a incomplete Inverse head and shoulders on LTC. For official confirmation the neckline must break and hold above it. Very similar pattern to what occured with BTC if you expand further out.
If the neckline holds the price target is
Height of head to neckline (price difference) X 2 = PT
Ps. Always set a stoploss

LTC LONG TERM FA- AMAZING GROWTH AHEAD 5000% to 11000% GROWTH!LTC was once well know=n as the SILVER to BTC Gold.
LTC is a REAL heavily used currency, fast with low costs, small number outstanding coins 85 million NOT 100 trillion as some of the meme coin , with a real and respected development team. LTC is not a meme coin. I have been using it for transactions for over a decade.
LTC is poised for insane growth ahead as it has multiple strong fundamental analysis signals on a 3M interval chart.
1. a double bottom. 2 base on base where the 2nd bottom is slightly greater than the first.
and 3. the most important, the entire chart is a flag pattern
These signal together almost guarantee a price 50x to 100x multiples of its current valuation.
I wouldn't START selling LTC until you see a 50 bagger and sell into the 100 bagger.
The charts and TA are never wrong.
This indicates there will be a MASS adoption of LTC somewher in the very near future.
Be grateful you are in a REAL heavily used currency, low outstanding coins, with a real and respected dev team. LTC is not a meme coin.

LTC Long Term Chart indicates AMAZING GROWTH AHEADLTC was once well know as the SILVER to BTC Gold.
LTC is a REAL heavily used currency, fast with low costs, small number outstanding coins 85 million NOT 100 trillion as some of the meme coins , with a real and respected development team. LTC is not a meme coin. I have been using it for transactions for over a decade.
LTC is poised for insane growth ahead as it has multiple strong fundamental analysis signals on a 3M interval chart.
1. a double bottom. 2 base on base where the 2nd bottom is slightly greater than the first.
and 3. the most important, the entire chart is a flag pattern
These signal together almost guarantee a price 50x to 100x multiples of its current valuation.
I wouldn't START selling LTC until you see a 50 bagger and sell into the 100 bagger.
The charts and TA are never wrong.
This indicates there will be a MASS adoption of LTC somewher in the very near future.
Be grateful you are in a REAL heavily used currency, low outstanding coins, with a real and respected dev team. LTC is not a meme coin.

Will Litecoin LTC outperform BTC this cycle? | I entered 200xLitecoin is looking very bullish across most indicators. Based on my study I do believe LTC is poised to outperform BTC this cycle.
I am Long 200x on WEEX dot com. Referral code: 654ox

LTCUSD SELL AT SUPPLY ZONE SMART MONEY CONCRPTHere on Ltcusd price form a supply around level of 135.685051 and is likely to fall more so trader should go for short with expect profit target of 102.050386 and 65.358023 .Use money management

Going for a quick long on 15 Min ChartGoing for a long based on 15 and 1 hr charts are trading above the 200.

Can LTC break major 145$ Resistance after a retest of 125-128$It looks like the worst is behind us on COINBASE:LTCUSD and it's preparing for its big cycle move with many altcoins following the same path. The down trend of lower highs and lower lows has been broken with conviction, the DPO on the daily is positive (Historically when that happens, LTC breaks ATH) and now all is left is a good entry! In your opinion, where do you think this market wide pullback can extend for LTC before we see a break of the major resistance at 145$ ??
COINBASE:LTCUSD BITSTAMP:BTCUSD CRYPTOCAP:TOTAL3

LTC 1:2 Ratio - LongLTC on the 1 hr Trading above the 100 and 200 EMA. Possible take a 1:2 ratio for a long. Happy Weekend.

LTC Breaking above its all time massive mid resistance!I think by sunday we'll see LTC at around 180s, Also with ETF filing news and Trumps inauguration around the corner it should be easy. Actually I am much more bullish on LTC than other coins like XRP, HBAR, SOLANA, DOGE...
My targets for LTC:
$1000 by the end of this bull cycle
$4000 - $7000 if ETF approved

Litecoin Breakout: Potential Gains and ProfitsAlright, let’s talk about Litecoin and why I think it’s gearing up for something big. The market's been showing solid gains across the altcoin sector , and Litecoin is definitely catching my eye right now.
Here’s the deal: the LTCBTC pair looks like it’s finally bottomed out and is breaking out of a two-year downtrend line . If that sounds familiar, it’s because we’ve seen this before. Back in 2017 , Litecoin broke out of a similar downtrend, and the result? LTCUSD skyrocketed from $8 to $365 in just a year .
Fast forward to today — 2023 and 2024 have been all about consolidation in the $100–$47 range . Now that we’ve broken through $135 , 2025 could be a massive year for Litecoin. My main target is $365 , but I’ve got my eye on some optional targets at $630 and even $1,300 .
Why those higher targets?
Simple. Looking at how the LTCBTC pair has performed in the past, even a small upward move there has historically triggered huge gains in LTCUSDT .
Now, let’s break it down further.
Litecoin’s price history shows recurring patterns — ascending triangles from 2015 to 2017 and now again from 2018 to 2025 . And these patterns play out in phases:
🔴 Downtrend
🟡 Consolidation
🟢 Breakout
We’ve already seen this cycle happen three times — 2014 to 2018 , 2018 to 2021 , and now 2021 to 2025 . It’s all lining up again.
The key now is to watch the details . Resistance levels, price action , and how the breakout unfolds will be crucial. If Litecoin follows through, it could be gearing up for a move that redefines its place in the market .
Stay tuned — this could get really exciting.🍻
Some of past LTC charts:

LTC could make 3x in the coming weeks! Don't miss itXRP did 6x in a few weeks and hit new ATH after 7 years!
If the dino coin trend continues, the next coin to update ATH will be #LTC ! A most hated rally amid rumors of a NYSE:LTC ETF is highly likely

$LTC looks goodETF is approaching, but nowhere near the last two ATH. Higher lows, very bullish chart.

LTC Breaking above tan invh&s neckline, right on goldencrossI have the weekly chart timeframe selected here simply because I needed to expand the timeframe on the chart to be able to fit both inverse head and shoulders patterns and their respective breakout targets in the frame. Wanted to put the timeframe on the daily chart so. Could show once again how these recent crypto pumps have all being launching on the exact day that the Daly golden cross occurs. I will post. Daily chart version of this as well that zooms in on the golden cross and subsequent priceaction and link it below. Anyways it looks like on this 2nd breach above the tan neckline that Litecoin is likely to finally trigger a breakout ths go around. If so the highest measured move target is in the $170s here, and reaching it will obviously also allow us to hit the white inverse head and shoulders breakout target too on the way there. In order to ensure that price acton doesn’t dip back below the tan neckline for a second time, it will need to flip the weekly 200ma(blue line) to solidified support once that happens I think it will definitely confirm the breakout at that point. Alt season has officially began! *not financial advice*

LTC about to complete right shoulder right @ the golden crossIf Litecoin’s price action reacts the same to its golden cross as many other crypto charts have recently, we will likely see Litecoin rise above the invh&s neckline i the coming days. A confirmed breakout from the invh&s has a breakout target of around $173. *not financial advice*

LTCUSD - first low price for purchase and then...Certain arguments will certainly make a difference, but they are unlikely to change the course.

its go time on ltcOkey the market has been wiping us around and has been very choppy.however i see positive divergence so i am long until more market data appears to support otherwise.

LTC/USD potential bullishThis LTC/USD 30-minute chart illustrates a potential bullish continuation within an ascending channel. Price action shows a steady climb, suggesting increased buyer momentum as it approaches key resistance at 110.45.
Unique Insight:
Trend Confluence: The price is respecting the trendline, showing alignment between short-term bullish sentiment and broader technical patterns.
Altcoin Sensitivity: Litecoin's movement often correlates with Bitcoin and overall crypto market sentiment. A BTC breakout could amplify LTC's momentum.
Halving Narrative: The anticipation of Litecoin's future halvings may support speculative buying, reinforcing upward potential in line with the channel's trajectory.
Monitoring the breakout above resistance or signs of divergence will provide valuable trading cues.

urgent update on ltc i see at this time 2 possibility's happening #we are finished with the ABC correction #2 we will see a lower low to finish wave-c. at this time i will expect to go lower.it looks as if we still need to finish 5-wave down.0.80 prediction.in any case be prepared because this move should happen soon!

Ltc can the correction be over?Can the correction be over it looks as if we can see a reversal if this plays out and start are recovery.
If we go below 100 we should she 80.00

It Was Just a Fake BreakoutLTC did very well with breaking out of the downtrend, but DXY decided to go up and LTC failed to successfully retest the breakout and fell back down below the trend line. Price will be bearish as long as LTC stays below this trend line. If price manages to break above this level and successfully retests this trend line then there will be hope for the fireworks. Right now there’s not fireworks, just a big fire that’s burning all the alts.

Dynamic Market Scanner [Progressive] - Updates and Improvements!Friends, I’m excited to introduce the updated version of my Dynamic Market Scanner! This is the progressive version, which includes enhanced features and new capabilities for more accurate and efficient trading.
In the screenshot, you can see how the indicator performs in real market conditions. I plan to release it very soon, so make sure to follow my profile to stay updated!
I’d love to hear your thoughts on the new version — what do you think of the idea, and what can be improved? Feel free to share your comments and experiences!"
This should help engage your audience and encourage feedback in the comments!
