Copper - the hot topic this weekUS is planning to implement tariffs on copper imports at a scale of 50%. It's an interesting move, which might not make much sense. Let's dig in.
MARKETSCOM:COPPER
COMEX:HG1!
Let us know what you think in the comments below.
Thank you.
75.2% of retail investor accounts lose money when trading CFDs with this provider. You should consider whether you understand how CFDs work and whether you can afford to take the high risk of losing your money. Past performance is not necessarily indicative of future results. The value of investments may fall as well as rise and the investor may not get back the amount initially invested. This content is not intended for nor applicable to residents of the UK. Cryptocurrency CFDs and spread bets are restricted in the UK for all retail clients.
CAH2028 trade ideas

RameThe break of all-time highs triggered an acceleration of the bullish movement.
The movement could continue if the orbital resistance at 5.895 is broken, with a target of 6.82 to be achieved by August 26, 2025.
The bullish scenario would be negated if the support at 5.25 is broken.

Copper Cup & Handle Formation - Confirmed by Half-Yearly CloseIn a recent interview, Kevin Warsh, a former Member of Board of Governors Federal Reserve said: “External shocks like wars, pandemics, and supply chain disruptions may cause a spike in prices, that's not inflation. That's more like the weather. Inflation's more like the climate.
Weather refers to the day-to-day state of the atmosphere. A storm may come, but it will eventually pass.
Climate is the long-term average of weather patterns, typically measured over 30 years or more. If the underlying causes of climate change are not addressed, they are likely to affect future weather — for example, storms may become more unpredictable, occur more frequently, and intensify when they happen.
Going back to the financial markets. Have we address the underlying causes of inflation climate today? If not, then with every war or rumors of war or tariff or any unwelcome surprises.
They are likely to become even more volatile than before, some more bullish and the others more bearish.
What is the real cause of inflation climate the world is facing? Debt. At every pit stop, I will keep checking if there’s any chance that U.S. debt might start trending downward. If it does, my existing strategies would have to change. But for now, I’m maintaining these strategies. Here are some examples:
With fears of inflation still in sight, stocks have become more volatile. Since inflation hit a high of 9% in 2022, we’ve seen stock market swings widen.
With fears of inflation, bonds are under pressure. The drop in U.S. bonds wasn't triggered by the “Liberation Day” tariff announced on 2nd April alone. In fact, bonds peaked in 2020 and broke below their main uptrend support when inflation hit 9%.
With fears of inflation are also driving commodities higher — from “weather” to “weather,” so to speak. I’ve been covering gold, bitcoin, silver, and soybean oil. Today, copper looks interesting to me. Let’s dive into the technical. I find the half-year chart particularly interesting.
On this half yearly chart. We can see as the close on 30th June, copper settled firmly, closed above its $4.44 resistance that has been tested for years. This study indicates that copper could be at the beginning of an uptrend. I will be looking out for buying-on-dips opportunities whenever they arise.
What Began Well, Grew Risky — Yet Opportunity Awaits. Besides debt, there are two other key elements that may trigger fears of inflation from time to time. What do you think they are?
I would like to hear your thoughts on this.
Video version:
Mirco Copper Futures
Ticker: MHG
Minimum fluctuation:
0.0005 per pound = $1.25
Disclaimer:
• What presented here is not a recommendation, please consult your licensed broker.
• Our mission is to create lateral thinking skills for every investor and trader, knowing when to take a calculated risk with market uncertainty and a bolder risk when opportunity arises.
CME Real-time Market Data help identify trading set-ups in real-time and express my market views. If you have futures in your trading portfolio, you can check out on CME Group data plans available that suit your trading needs www.tradingview.com
Trading the Micro: www.cmegroup.com
www.cmegroup.com

Copper: Cycle TopLooking at Copper, is back near the highs due to tariffs. Miners are probably producing more, but industrial buyers won’t keep paying these high prices forever. That’s usually when investors get hurt.
Current phase its a cycle top IMO.
GH

Copper LongsBullish Bias for copper. Looking for daily BPR target, then possibly relative equal highs.
Ideally would like to pair a bullish weekly profile with longs. If the week opens lower first and delivers to a key level, thats favoring longs. So looking for Monday, Tuesday or Wednesday to create the low of the week.
I see a daily MMBM in play. Price expanded off the breaker block. If bsl is the dol, price should expand hard of EQ of the range.

MR. COPPER GOES FUN. WITH DONALD TRUMP — IT IS A BULL RUNCopper prices in 2025 are up about 27 percent year-to-date, driven by a complex interplay of technical and fundamental factors, with geopolitical events such as the Trump administration's tariff policies and the escalation of geopolitical tensions in the Middle East having a significant impact.
Fundamental Outlook:
The main driver of copper prices in 2025 is the ongoing global surge in demand driven by the transition to clean energy. Copper is essential for electric vehicles (EVs), renewable energy infrastructure, and grid upgrades, all of which require extensive use of copper due to its superior electrical conductivity.
For example, EVs use about 2-4 times more copper than traditional vehicles, and renewable installations such as wind turbines contain several tons of copper each. This structural growth in demand underpins the optimistic outlook for copper in the medium to long term.
On the supply side, however, copper production is growing. The International Copper Study Group (ICSG) forecasts a global copper surplus of 289,000 tonnes in 2025, more than double the 2024 surplus. This surplus is driven by rising production, particularly from new or expanded operations in the Democratic Republic of Congo, Mongolia, Russia and elsewhere.
Capacity increases in these regions, coupled with smelter growth, could contribute to a supply glut despite strong demand.
Conversely, geopolitical tensions in the Middle East could disrupt bauxite and alumina supply chains, a region that is a strategically important supplier of raw materials.
Impact of Trump Tariffs:
The Trump administration’s threats and actions to impose tariffs on U.S. copper imports have added volatility and complexity to the market. The tariff announcement triggered a sharp sell-off in early April 2025 as concerns about the impact on US manufactured demand and global trade flows grew. London Metal Exchange (LME) copper prices fell to one-month lows following China’s retaliatory tariffs, before partially recovering after some tariff exemptions and reductions were announced.
The tariffs also distorted physical supply chains. Traders rushed to deliver copper to the US ahead of the tariffs, reducing copper availability in other regions such as China. This arbitrage resulted in a significant widening of the price differential between US CME copper contracts and LME copper prices, with US prices trading at a premium of over 10% to London. This premium reflects the tariff risk embedded in the US copper price and expectations of temporary domestic market tensions.
Technical Outlook:
Technically, copper prices have shown resilience despite the tariff shocks. Copper prices sold off after peaking in late March 2025 before the tariffs were announced, but have since begun to recover.
Long-term trendlines and moving averages remain supportive, with the 100-week and 200-week moving averages trending higher and forming a bullish crossover earlier in the year.
Long-term copper prices are once again attacking the 18-year resistance around $4.50/lb ($10/kg) that capped the upside in 2008 and again in the 2010s and first half of the 2020s, with a 1.5x rally in the next 1 to 3 years.
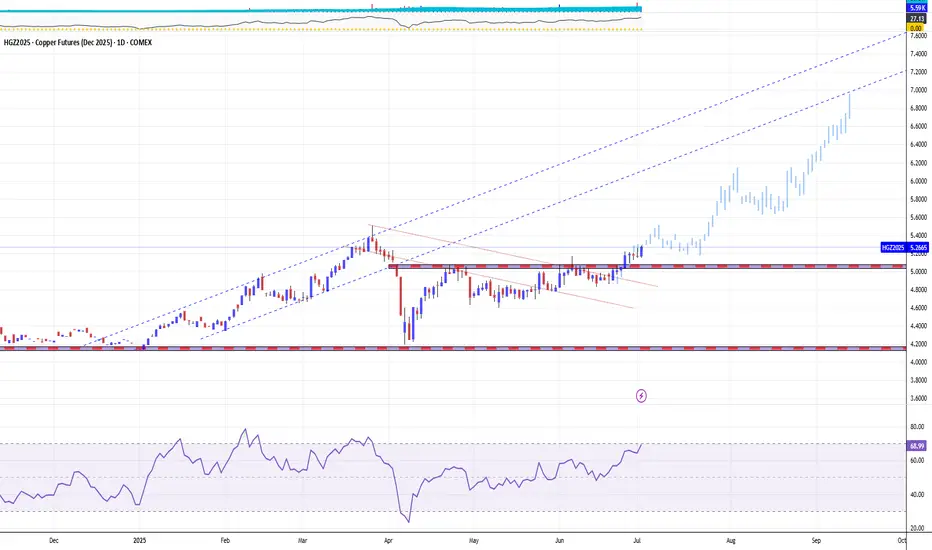
The technical main chart of the COMEX December 2025 copper futures contract COMEX:HGZ2025
points to the possibility of an upside move, all the way to the $7 mark (around $15/kg) as early as H2 2025.
Conclusion
Going forward, copper prices are expected to remain volatile but supported by long-term structural demand growth, with the impact of tariffs likely to cause episodic disruptions rather than a sustained suppression of increasingly hot prices.
--
Best wishes,
@PandorraResearch Team😎
Copper LongCopper is now net long on the regression break.
The roll long is -0.06%
I am not taking this trade.

Copper: Event-driven Trade Idea on Recent TariffsCOMEX: Micro Copper Futures ( COMEX_MINI:MHG1! ), #microfutures
The Event
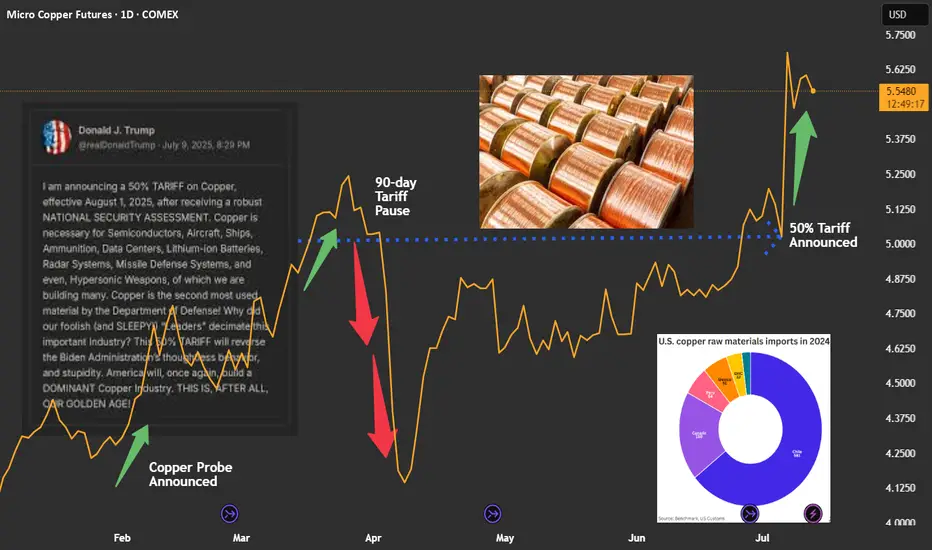
On July 9th, President Trump announced that he would impose a 50% tariff on imports of copper, effective August 1st.
The decision was based on national security assessment. Copper is the second most used material by the U.S. Department of Defense. The President intents to use tariffs to reduce reliance on imports and shore up support for domestic production.
Immediate Market Reaction
U.S. copper prices ended Tuesday’s session over 13% higher — the sharpest single-day gain since 1989. The September COMEX copper futures contract was settled at $5.584 a pound on Friday, up 35.7% year-to-date.
Due to tariffs, Copper in the U.S. is priced at a large premium over international markets.
• UK: LME copper contract was quoted at $9,660.5 per ton on Friday.
• China: SHFE coper futures was settled at RMB 78,420 per ton. It can be converted to $10,959.4 via the Dollar/RMB exchange rate of 7.1555.
• US: COMEX copper quote of $5.584 can be converted to $12,312.7 per ton.
• As of Friday, COMEX copper is priced at a 27.5% premium over LME copper, and a 12.3% premium over SHFE copper.
The U.S. Copper Market
The U.S. Geological Survey reports that the 2024 total refined copper consumption was 1.8 million metric tons. Of which, 850,000 tons were from mining, 150,000 tons were refined from scrap, and 810,000 tons from imports.
Chile is the biggest source of U.S. copper imports, accounting for 581,000 tons, or 71.7% of total imports. Canada is the second largest, for 169,000 tons, or 20.9%.
Copper is a widely used base metal, found in products ranging from machinery, electronics, household goods, housing, infrastructure projects, to aircraft and missiles.
Since President Trump announced a probe into copper in February, traders have been poised for a hike on copper duties, leading to major shifts in inventories away from Europe and Asia and into the U.S.
The Next Event: Will the Copper Tariffs get postponed or reduced?
The goal to increase domestic production of copper is very challenging. It will take years to ramp up and decades to fully meet demand — at a massive upfront investment cost.
Hiking the import duties would not help national security. It could not change the fact that the biggest copper mines are in Chile, Peru and Canada. A sharp increase in the cost of copper will quickly translate into wide-ranging inflation in the U.S.
In my opinion, once the Trump administration realizes the full impacts, we could possibly see a crawl-back from the intended copper tariffs. The effective date would be postponed, the tariff rate could be reduced, and many companies may get exemption/waiver. We have seen similar maneuvers happening multiple times in the past few months.
Overall, the actual impact of copper tariffs will be much smaller than the original announcement.
Shorting COMEX Copper Futures
Historically, the price difference between COMEX and LME coppers has been near-zero and was around the $150 level in 2024.
Since February, COMEX copper has been trading at $500-$1,500 premium over LME. As of Friday, COMEX copper futures have gone up 35% this year and are now priced at $2,652 per ton above LME copper.
In my opinion, these price differences reflect no economic fundamentals. It is purely due to the ever-changing global tariff conflict. If President Trump rescinds his tariff narratives, we could likely see a large drop in COMEX copper prices.
A trader sharing this view could explore shorting the COMEX Micro copper ( GETTEX:MHG ).
Last Friday, the September micro copper futures contract (MHGU5) was settled at 5.5910. Each contract has a notional value of 2,500 pounds of high-grade copper, or a market value of $13,977.5. To buy or sell 1 contract, a trader is required to post an initial margin of $1,100. The margining requirement reflects a built-in leverage of 12.7-to-1.
Let’s use a hypothetical trade to illustrate how to use a short futures position to take advantage a potential reduction on copper tariffs.
Hypothetical Trade:
• Short 1 MHGU5 contract at 5.5910, and set a stop loss at 6.00
• Trader pays $1,100 for initial margin
Scenario 1: Tariffs go into effect, copper rises to $6.57
• Futures reflect a 50% premium over current LME copper price, which is at $4.38 per pound
• Short order stop loss at 6.00, and the maximum loss is $1,022.5 (= (6-5.591) x 2500)
• The trader loses most of the margining fund, but owes no more
Scenario 2: Trump Rescinds Tariffs, Copper falls to $4.38
• COMEX copper will be priced at No premium over LME
• Short position gains: $3,027.5 (= (5.591-4.38) x 2500)
• The hypothetical return will be 275.2% (= 3027.5 / 1100)
The above scenarios show that
• When copper falls, short position will have higher returns due to its leverage nature.
• When copper rises, the stoploss will kick in to set maximum losses.
The above trade idea could be deployed using the standard-size Copper Futures contract. Its notional value is 25,000 tons, which is 10 times bigger than that of the micro contract. The initial margin is $11,000. The standard-size contract is more liquid. On Friday, it had a total volume of 60,313 contracts, and an open interest of 221,682.
Happy Trading.
Disclaimers
*Trade ideas cited above are for illustration only, as an integral part of a case study to demonstrate the fundamental concepts in risk management under the market scenarios being discussed. They shall not be construed as investment recommendations or advice. Nor are they used to promote any specific products, or services.
CME Real-time Market Data help identify trading set-ups and express my market views. If you have futures in your trading portfolio, you can check out on CME Group data plans available that suit your trading needs www.tradingview.com
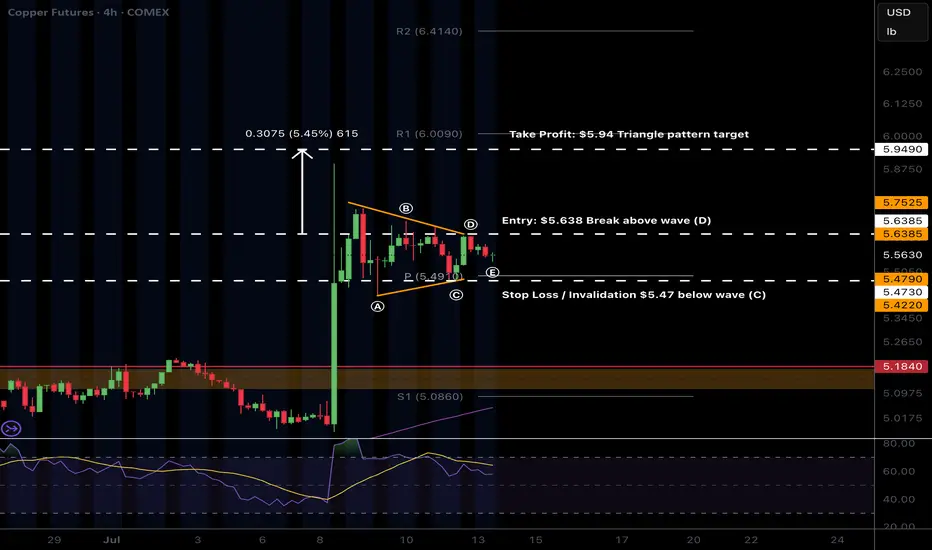
$COPPER triangle trade?CAPITALCOM:COPPER triangle has potentially printed and a triangle is an Elliot wave pattern that results in a terminal thrust up to complete a motif wave.
That would trap bulls as price terminates with a poke above the all time high keeping them believing they can capture the same gains already gone.
After the termination wave 2 often finds support at the triangle base.
Safe trading
Price correction and re-increase in copper prices1.Growing Global Demand: Rising infrastructure projects and renewable energy initiatives (like EVs and energy storage systems) are boosting copper demand.
2.Supply Constraints: Declining reserves in major mines, production disruptions in key producers (e.g., Chile, Peru), and limited new investments are tightening supply.
3.Weaker USD: If the Fed cuts interest rates, a weaker US dollar (as copper is dollar-denominated) could push prices higher.
4.China’s Recovery: Economic stimulus in China (the world’s top copper consumer) is expected to drive stronger demand.
5.Inflation Hedge: Copper is seen as a hedge against inflation, attracting more investor inflows if global inflation persists.
Strong demand, tight supply, and supportive macro trends could drive copper prices upward in the coming months.
Sasha Charkhchian

Copper1! at Best Support !!This is the 2 chart of Copper1! .
Chart 1 Analysis:
The stock is trading near a parallel channel support zone in the 880–890 range. This zone also aligns with the monthly pivot and weekly pivot support around 882–880. Additionally, the percentage fall is nearly complete near 885, further strengthening this level as a potential support zone.
Chart 2 Analysis:
On the monthly Heikin Ashi chart, support is observed near 864, while the weekly Heikin Ashi support lies around 880.6. By connecting key levels, it indicates that Copper may find support in the 880–885 zone.
Thank You !!

Long Setup: Micro Copper Futures (Jul 2025)While U.S. equity markets are closed in observance of Juneteenth, traders in the futures markets still have opportunities to position ahead of broader market moves. One such opportunity is forming in Micro Copper Futures (MHGN2025), which continues to consolidate in a tight range near key technical levels. The current structure suggests a potential breakout to the upside with a favorable risk-reward setup.
Technically, price action remains compressed between approximately 4.70 and 4.90, coiling just above the Ichimoku Cloud and holding support above the mid-April range. This zone has acted as a critical demand area multiple times since April, and the market has rejected any meaningful downside continuation, signaling underlying strength.
A long position is being considered based on the following:
Entry Zone: Around 4.81, above the flat Kijun-sen and within the current range high.
Stop Level: Set at 4.7080, just below the support band and Ichimoku base, providing technical invalidation if broken.
Target: 5.10, aligning with previous resistance and psychological round number. This would complete a 6.8% upside move from current levels.
Risk/Reward Ratio: 2.64, indicating strong asymmetry favoring the long bias.
The MACD histogram remains positive despite flattening out in recent sessions, while the signal line crossover earlier in June continues to support the bullish case. Although momentum has paused, it has not turned negative, which may point to a consolidation phase before the next leg.
The broader copper narrative also lends support to this setup. With persistent demand from renewable infrastructure, data centers, and EVs, copper remains a fundamentally supported commodity despite near-term volatility driven by macro factors and central bank policy. Any fresh economic stimulus out of China or signs of rate stabilization globally could provide the catalyst for a bullish breakout in base metals.
Traders should monitor volume and any breakout beyond the 4.89–4.90 zone, which could trigger further buying. A daily close above 4.90 on increased volume would confirm the breakout and improve the probability of reaching the 5.10 target.
While today’s market holiday may reduce liquidity temporarily, it also offers a less crowded environment for early positioning. As always, risk management is paramount, and trade sizing should reflect the volatility and leverage of commodity futures.
This setup remains active and will be reassessed if price fails to hold above the key support zone or if macroeconomic conditions materially shift in the near term.

Bullish Reversal Builds in Copper: Eyes on $5.20 Resistance
The current price has closed above the Bollinger Band middle line (20-day SMA), indicating short-term upward momentum.
A sustained close above 4.90–4.95 could open the way to challenge the psychological level of 5.00 and possibly 5.20.
Immediate resistance: 4.95 → 5.00 → 5.20
Support zones: 4.75 (middle band) → 4.60 (recent low) → 4.45 (lower band)

Copper Nears Annual HighCopper Nears Annual High, Driven by Trade Optimism and Falling Inventories
By Ion Jauregui – ActivTrades Analyst
The copper market is once again in the spotlight. The metal is currently trading at around USD 9,756 per tonne on COMEX futures at the London Metal Exchange (LME), approaching its annual high reached at the end of March, near USD 10,000. This rally is supported by a combination of macroeconomic drivers and market-specific factors.
China–U.S. Dialogue Boosts Demand Outlook
One of the key catalysts behind this upward move has been the recent diplomatic thaw between China and the United States, which has improved the global trade climate. Trade negotiations held in London have renewed optimism about global economic growth, which naturally strengthens the projected demand for industrial metals like copper—widely used in construction, energy, and technology sectors.
LME Inventories at Lows Add Upward Pressure
Adding to this context is a significant decline in inventories recorded at the LME. This drawdown reflects both an increase in physical consumption and speculative positioning amid potential new tariff policies that could follow the current trade truce. This relative scarcity in physical supply has become another driver of price gains.
Technical Analysis of Copper (USD/lb)
As of early trading hours, copper is quoted at approximately USD 476.5 per pound, according to ActivTrades data. The asset has shown strong upward momentum from July 2023 through May 2024, with a brief correction down to USD 399.70, a key technical support level for the ongoing rally that began in mid-April. The Point of Control (POC) for volume is located around USD 467, holding above an intermediate support level at USD 449.13, reinforcing the short-term bullish structure.
As for resistance levels, USD 505.32 stands out as the main ceiling to overcome. Currently, the price is fluctuating within a technical range between USD 494.22 and USD 442.61, suggesting a consolidation phase ahead of a potential breakout.
Conclusion
Copper remains one of the most dynamic industrial metals in today’s macroeconomic landscape. Renewed trade optimism between the world’s two largest economies, combined with a sharp drop in LME inventories, has created a solid set of fundamentals justifying the approach toward annual highs. Technically, the bullish structure remains intact as long as key support levels hold, and a sustained close above USD 494/lb could pave the way for fresh short-term highs. In this context, copper not only reflects the pulse of global industry but also embodies the economic growth expectations in a time of geopolitical and energy transition.
*******************************************************************************************
The information provided does not constitute investment research. The material has not been prepared in accordance with the legal requirements designed to promote the independence of investment research and such should be considered a marketing communication.
All information has been prepared by ActivTrades ("AT"). The information does not contain a record of AT's prices, or an offer of or solicitation for a transaction in any financial instrument. No representation or warranty is given as to the accuracy or completeness of this information.
Any material provided does not have regard to the specific investment objective and financial situation of any person who may receive it. Past performance is not reliable indicator of future performance. AT provides an execution-only service. Consequently, any person acting on the information provided does so at their own risk.

Chart Pattern Analysis Of Copper.
There are 4 candles close upon the neckline of a potential bullish triangle pattern,
It seems that another bull run will start here.
I am expecting an accelerate motive wave to touch or break up the target line.
On the other hand,
If K4 couldn’t close upon K1 to verify the strong bullish momentum,
It is also possible that a short-term consolidation will carry on from K1.
If the following candles successfully resets the resistance,
It is also a good place to buy it then.
Long-875/Stop-870/Target-920
Long-881/Stop-870/Target-920

DR COPPER vs GOLD as a Safe HavenAn enlightening ratio provides additional proof that 2026 is set to be a remarkable year of economic growth, propelling us into the upcoming peak of the #AI cycle.
A key indicator of the AI peak is the initial public offering (IPO) of Open AI on the stock market. This is a definitive signal to capitalise and harvest as much economic energy as possible during the euphoric frenzy, and establish Open AI as a new Tech Titan for the next decade.

How can I be late to the copper bull era?How can I be late to the copper bull era when the party hasn’t even started?
The rocket-ship moments for copper lie ahead—not behind us.
There’s no need to front-run anything.
No pressure. No rush. Just readiness.
Wait.. where did I read something similar before... Mmm

Copper to Pump soon, W formation and small cap rumblingsIf you look closely there's a beautiful W formation that has been tested numerous times and has passed. This is high time frame and inconsideration of goals massive run, market makers are going to be looking into smaller cap assets this time of year. Small cap accumulation will last about 2 years. The precious metals like copper which are akin to small caps are going to eat as well. Looks like it's going to double or triple in value notice the parallel Channel as well. Measured moves off the W show the targets.

Copper & Fib..... My fovourite.... Copper getting into a super Bullish tone ??
870 & 890 are good resistance levels, but also magnetic levels. Lets see if prices are drawn towards it. Above 50ema & 20o ema, so looks ggod.

Copper in a TriangleCopper has been forming a triangle for weeks now and appears to be getting to a decision point. Copper is flirting with the monthly pivot and stuck perfectly between the PWL and PWH. This one is wait and see as well.

Candlestick Reversals vs. IndicatorsA simple question to think about. Do indicators make charts too confusing, have mixed success, and ultimately fall victim to whipsaw with an occasional big winner?
Would it be better to use an indicator free daily chart and just observe the buyer and seller psychology that candlesticks offer?
Candlestick patterns are powerful. Especially when you observe them around areas of price congestion, support or resistance.
I would love to hear some opinions on these questions. For and against my thoughts.

Morningstar Candlestick Pattern Forming at the monthly PivotThis 3 candle pattern is a good indicator that a bullish reversal is underway. Price was driven lower on day 1. On day 2 price was initially driven lower but buyers stepped in to take control. And they took control at the monthly pivot which adds even more significance to the move. Finally, on day 3 price moved up which means buyers are in control and bears are losing control. This is likely headline driven and economic outlook driven but the momentum shift at the monthly pivot is an important point to note.

Just documenting so i can witness my failure later, do not care.If the price closes above the line, weekly, usd/ton , after a correction we will see that it goes to the moon
