Copper Futures (M6E1!), H4 Potential for Bearish DropType : Bearish Drop
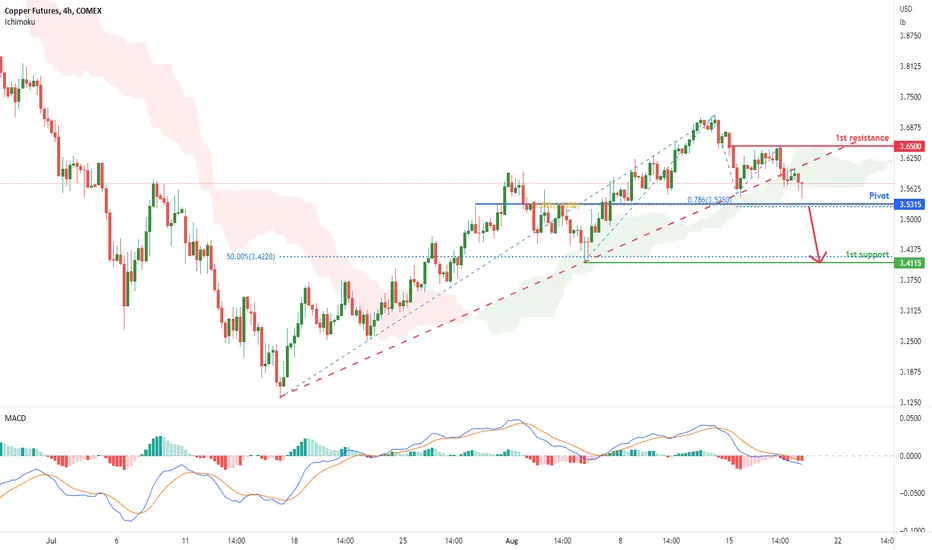
Resistance : 3.6500
Pivot: 3.5315
Support : 3.4115
Preferred Case: On the H4, with the price breaking the ascending trendline and ichimoku cloud , we have a bearish bias that the price may drop from the pivot at 3.5315, which is in line with the 78.6% fibonacci projection and 61.8% fibonacci retracement to the 1st support at 3.4115, where the 50% fibonacci retracement and swing low are.
Alternative scenario: Alternatively, the price could rise to the 1st resistance at 3.6500, where the pullback resistance is.
Fundamentals: The copper price fell as the market worries about demand in China surfaced due to weak economic data and a firmer dollar. Meanwhile, Chinese property developers sharply cut investment in July, while new construction starts suffered their biggest fall in nearly a decade.
CA1! trade ideas

Copper Futures (M6E1!), H4 Potential for Bearish DropType : Bearish Drop
Resistance : 3.6500
Pivot: 3.5315
Support : 3.4115
Preferred Case: On the H4, with the price breaking the ascending trendline and ichimoku cloud, we have a bearish bias that the price may drop from the pivot at 3.5315, which is in line with the 78.6% fibonacci projection and 61.8% fibonacci retracement to the 1st support at 3.4115, where the 50% fibonacci retracement and swing low are.
Alternative scenario: Alternatively, the price could rise to the 1st resistance at 3.6500, where the pullback resistance is.
Fundamentals: The copper price fell as the market worries about demand in China surfaced due to weak economic data and a firmer dollar. Meanwhile, Chinese property developers sharply cut investment in July, while new construction starts suffered their biggest fall in nearly a decade.

Copper Commodity USA Sun Storm Investment Trading Desk & NexGen Wealth Management Service Present's: SSITD & NexGen Portfolio of the Week Series
Focus: Worldwide
By Sun Storm Investment Research & NexGen Wealth Management Service
A Profit & Solutions Strategy & Research
Trading | Investment | Stocks | ETF | Mutual Funds | Crypto | Bonds | Options | Dividend | Futures |
USA | Canada | UK | Germany | France | Italy | Rest of Europe | Mexico | India
Disclaimer: Sun Storm Investment and NexGen are not registered financial advisors, so please do your own research before trading & investing anything. This is information is for only research purposes not for actual trading & investing decision.
#debadipb #profitsolutions

Copper Trading The Corrective SequenceIn this update we review the recent price action in Copper and identify the next high probability trading opportunities and price objectives tot target

HG1! Copper 2618 trade?interesting level to watch if there is any reaction here
Not fantastic level, but could offer clues when it gets there to try and minimise stop loss

HG1! Copper Monthly retracement likelyAs per my monthly divergence note, we have hit the target zone at the 50ema
A medium term retracement is likely to around the 61.8% - will look on lower time frames to see if there are any zones there that would be worth watching when we get closer

Dr Copper Monthly ChartLooks like market is going to suffer in the medium term
Dr copper showing clear signs of reversing and reverting back to at least the 50ema/ lower bollinger band zone
Not great for stocks in general....

Dr Copper .. rev s-h-s targets $400 to catch up with S+P On it own, copper is near completion of a rev s-h-s targeting $400 area, and that may be enough technical justification to go long here, hoping for the imminent break out.
Look at it vs S+P and you see there is already a lot more optimism building in the (US) equity markets and I guess that makes sense, as China is facing great difficulties and Europe is equally challenged by extreme energy prices and geo political instability. Obviously, thanks to President Biden, we are seeing the US pass hugely important legislation on energy use transition.
I would say, prices are there to be respected and copper is certainly testing the last of the eco-Bears out there.
Maybe give it a few more $ to the upside to see that neck line breaking for confirmation. Incomplete s-h-s are typically quite treacherous but it seems to me there is good fundamentals behind this too.

The rally is funny but the doctor its lostCopper will fall following the depression currently happening.
Next to follow

Cooper Shine like a diamondCooper going to make a short for a make a correlation
After this i will make a entry for long to keep until xmas position trade:P

Heading for Recession or going higher...analysis and key levelsThere has been a lot of talk of the US heading into recession, and while the Fed and Politicians deny it, most feel that we are already 'in' a recession.
The Fed will of course do and say all they can to keep the stock markets orderly and supported while trying their best to bring down inflation. Key now is to watch inflationary and economic data.
In the video I look at the major stock markets in the US , Europe and Asian...and look at the key levels that I am watching for some action. Technically the Indexes are still in a downtrend but we have seen some buyers go risk on into the end of the month....so the question is will this continue??!!

Copper commodity USA Sun Storm Investment Trading Desk & NexGen Wealth Management Service Present's: SSITD & NexGen Portfolio of the Week Series
Focus: Worldwide
By Sun Storm Investment Research & NexGen Wealth Management Service
A Profit & Solutions Strategy & Research
Trading | Investment | Stocks | ETF | Mutual Funds | Crypto | Bonds | Options | Dividend | Futures |
USA | Canada | UK | Germany | France | Italy | Rest of Europe | Mexico | India
Disclaimer: Sun Storm Investment and NexGen are not registered financial advisors, so please do your own research before trading & investing anything. This is information is for only research purposes not for actual trading & investing decision.
#debadipb #profitsolutions

HG1!7.28.22 I want to kill you something about price action And structure as a pertains to copper. I believe many traders who look at this won't recognize the importance of structure in this particular example, so it's important to look at this as a study around structure. The most immediate reason to look at this market is that it found support and a reversal pattern want a ranging market moving lower, and we would have been able to get into this market as a buyer when many Traders would think that the market would probably go lower... and that would have been a very expensive mistake. The market went up about 6 or $7,000 per contract at the reversal, so if money is your thing, the trade worked. and now I have exonerated myself from any further responsibility. Hopefully if anything important happens and I'm watching, I'll try to let you know. Learning a concept how to use structure for your trade decisions is the most important thing in this video in my opinion.

Go long next daysGo long next days, we have a strong probability that the copper will rise approximately 8%.

Starting a long position for a swing Here i am starting a long position for a swing traders .
Take a loon please make sure you are in risk management . Be careful on lot size .

Bitcoin Copper7. 23. 22 I'm using Bitcoin and copper as examples of the same set up. You could do this with any market. It's a coincidence that I I've been posting videos on two different markets that happened to have the same type of reversal pattern. These patterns have associated risk and reward and probability. These markets are not oversold or over bought markets... which have their own probability and expectations. It's important to understand some of the characteristics I'm talking about. I think it's equally as important to recognize what kind of trader you want to be. Some Traders really need to be longer-term because it fits their lifestyle, their available time If their personality. It is actually better for them to not constantly look at the chart.

Copper Appears To Have Finished an ABC CorrectionCopper appears to have finished a perfect ABC correction that has terminated at precisely the 0.618 Fibonacci level. According to the Elliott wave model, copper should begin another five-wave move up of primary degree that eventually surpasses its March high.
There is one reason to be cautious, however. Copper still has bearish seasonality until August 15. If you bought copper on July 22 and sold copper on August 15 every year for the past ten years, you would have lost money for eight years (80%).
In general, I trust the Elliott wave model more than I trust seasonality but a historical win rate of only 20% is nothing to joke about. The current Elliott count will be invalidated if prices decline below the July 15 low of 3.1315. Risk should be tight, and the trade should be abandoned if prices drop below this level.

quarterly defined supportWhat about copper?
-Important support right here
What about silver?
-Important support right here
#stagflation

MR.COPPER .618 MAJOR SUPPORT 4 now Chart posted is that of copper . we have 3 legs now down in the bear market . a natural target for support as it hit a 618 at BEST you can look for an ABC or abc x abc up until aug25 to sept 2 then CRASH

Copper to $10+ by 2024. Easy. ~$4.50 today is fundamentally not the same as ~$4.50 in 2011 - the last time copper traded at these prices. QE was fresh off the block in 2011. today, it is standard operating procedure and although the fed talks a good game with tapering, we have yet to see any balance sheet reduction.
Looking at this monthly chart, I noticed an interesting double bottom that hits its' target before entering price discovery between 1999-2006. the pattern is not perfect but it looks really similar to copper 2016-2022. Double bottom, target reached around $4.30, and now we're off to the races - price discovery.
I think copper to $10 in under 2 years is a very safe bet. It doesn't threaten fiat as much as gold/silver and is manipulated less as a result. It is critical in many industries and the push for everything to go IoT will continue the increasing pressure on copper as well.
Let's see how this one ages.

Copper in free fall, but ...It is well known that due to the current circumstances of multifactors of the negative order, they are causing a Global crisis, which in turn cuts the industrial demand, clearly that happened in the past and is clearly illustrated in the last crisis ( "Subprime Crisis" ).
we have clear then the "high ceilings" and the "low floors",.
although there is copper falls without stopping,
but remember that this element is essential for the industry
in future mankind in electromobility plus also of electronics in general and industrial and so on.
and that is why the deep zone would eventually be a good buying zone. ,
also the fall of this metal is closely related to the Chilean ( clp ) peso.

copperThe support index lost $3.3.
But static support is $2.96 and dynamic support is #2.
The negative divergence caused the price to fall, but now we are seeing a positive divergence as it approaches the $2.7 support.
We should wait and see if the price will be supported by this strong downward momentum or not?
