LOOMUSDT 5DLOOM ~ 5D Analysis
#LOOM Buy gradually from here if you still have a Conviction on this coin with a short -term target of at least 20%+.
LOOMUSDT trade ideas

LOOMUSDT 5DLOOM ~ 5D Analysis
#LOOM This is the lowest support for now. Buy from here if you still have a Conviction on this coin with a minimum target of 20%+

LOOMUSDT %180 Daily Volume Spike! Active Buyers!LOOMUSDT has seen a 180% increase in volume , indicating strong buyer activity. These levels present potentially good entry points ; however, given the overall market conditions , achieving a significant rise could be challenging. It is essential to manage your risk carefully .
Key Points:
Volume Spike: A 180% increase signals heightened activity and buyer interest.
Market Conditions: Weak general conditions necessitate cautious and calculated risk-taking.
Confirmation Indicators: I rely on CDV, liquidity heatmaps, volume profiles, volume footprints, and upward market structure breaks on lower time frames for validating trades.
Learn With Me: If you want to master how to use CDV, liquidity heatmaps, volume profiles, and volume footprints to identify accurate demand zones, just DM me. I’d be happy to guide you!
Reminder: Be aware of the market's current state and approach it with caution. Successful trading relies on meaningful levels and robust confirmations.
If you think this analysis helps you, please don't forget to boost and comment on this. These motivate me to share more insights with you! Wishing everyone success in their trades.
If you think this analysis helps you, please don't forget to boost and comment on this. These motivate me to share more insights with you!
I keep my charts clean and simple because I believe clarity leads to better decisions.
My approach is built on years of experience and a solid track record. I don’t claim to know it all, but I’m confident in my ability to spot high-probability setups.
If you would like to learn how to use the heatmap, cumulative volume delta and volume footprint techniques that I use below to determine very accurate demand regions, you can send me a private message. I help anyone who wants it completely free of charge.
My Previous Analysis
🐶 DOGEUSDT.P: Next Move
🎨 RENDERUSDT.P: Opportunity of the Month
💎 ETHUSDT.P: Where to Retrace
🟢 BNBUSDT.P: Potential Surge
📊 BTC Dominance: Reaction Zone
🌊 WAVESUSDT.P: Demand Zone Potential
🟣 UNIUSDT.P: Long-Term Trade
🔵 XRPUSDT.P: Entry Zones
🔗 LINKUSDT.P: Follow The River
📈 BTCUSDT.P: Two Key Demand Zones
🟩 POLUSDT: Bullish Momentum
🌟 PENDLEUSDT.P: Where Opportunity Meets Precision
🔥 BTCUSDT.P: Liquidation of Highly Leveraged Longs
🌊 SOLUSDT.P: SOL's Dip - Your Opportunity
🐸 1000PEPEUSDT.P: Prime Bounce Zone Unlocked
🚀 ETHUSDT.P: Set to Explode - Don't Miss This Game Changer
🤖 IQUSDT: Smart Plan
⚡️ PONDUSDT: A Trade Not Taken Is Better Than a Losing One
💼 STMXUSDT: 2 Buying Areas
🐢 TURBOUSDT: Buy Zones and Buyer Presence
🌍 ICPUSDT.P: Massive Upside Potential | Check the Trade Update For Seeing Results
🟠 IDEXUSDT: Spot Buy Area | %26 Profit if You Trade with MSB
📌 USUALUSDT: Buyers Are Active + %70 Profit in Total
🌟 FORTHUSDT: Sniper Entry +%26 Reaction
🐳 QKCUSDT: Sniper Entry +%57 Reaction
I stopped adding to the list because it's kinda tiring to add 5-10 charts in every move but you can check my profile and see that it goes on..

Are we going to see $LOOMUSDT pump above $0.10 ??POLONIEX:LOOMUSDT is getting ready for a pump to $0.10 and above. A bullish flag was formed after POLONIEX:LOOMUSDT breached the $0.08 resistance zone which now serves as a support, and this bullish flag has been broken. An incoming push to $0.10 and above is expected from POLONIEX:LOOMUSDT using a measured move from the low to the high of the bullish flag. Using these information, a bullish trade setup is ready.
Parameters
Entry: 0.081
TP1: 0.085
TP2: 0.090
TP3: 0.101
SL: 0.076
This is a 1:4 RR Bullish setup.
Like and comment your thoughts about the setup.

LOOM ALL SETThat Fbuy print is perfect entry for Loom. Loom has great potential with AtH at half a dollar. Now we have a good volume today. So x2 can happen if everything goes well
DYOR
for indicator access, you can message me.

Loom chartLoom chart.
Key levels of support and resistance. each level can reject to a new low or become support.
This is made using alien technology.

$LOOM hovering on a support trendline in confluence with 200ema Ascending Support Line: The price is respecting a clear ascending trendline, acting as support. Every time the price touches this line, it bounces back, suggesting that buyers are still in control.
Moving Average: The 200-period moving average (red line) is providing additional support, and the price is currently above it, which typically signals a bullish bias.
Potential Breakout: The projected price action shows a bullish scenario with a potential 28% upside from the current level. The target indicated on the chart is around $0.07130, with a current price of $0.05574.
Resistance Levels: The upper horizontal resistance is marked near $0.07130. Breaking this level could open the door for a larger upward movement, but this would depend on the strength of the volume and market conditions.
Price Target: If the ascending support continues to hold, the price may rise gradually before breaking out toward the $0.07130 resistance, representing a potential 28% gain from the current level.

LOOMUSDT: Bullish TrendLOOM is moving in top ten gainers, and its uptrend without any bearish sign. So we will wait for the touch the FIB golden area (buying Area). there is possibility LOOM will be reach 0.618 to 0.5 level of the FIB. So we will take a long trade on these point with proper risk management. If LOOM break its HHs we will take a long trade on CMP with same TP and SL.

LOOM/USDT 4H AnalysisBINANCEUS:LOOMUSDT Price is consolidating above a key support zone, indicating a possible bullish breakout.
Target is set at $0.0792, suggesting significant upside potential if the current support holds.
Watch for a strong move upward soon! 🚀📈 #LOOM #CryptoTrading #Altcoins #TechnicalAnalysis

Loom Network: 600% or 2,600%? Let Me Explain... (Disclaimer)Remember Loom Network last year? It grew more than 1,250% in 6 weeks. This happened on both the Tether (USDT) and Bitcoin (BTC) pairs.
In 2020/21 it grew ~3,400%. I think we are set for another strong wave, simply based on past action.
Potential is huge... Loom Network has been printing higher lows long-term, and higher highs. It has been bearish since October 2023 and recently it stopped dropping after hitting the same support levels three times. We are likely looking at another long-term higher low. These are marked on the chart with black lines.
We are aiming mainly at the 624% target. That is, between 385% and 624% on the chart. This is the "easy," high probability target.
We are not greedy and such a trade, even if we had to wait, say 6 months, would be awesome. The truth is though that it can play out much faster.
Long-term higher lows signal a new higher high potential in the upcoming bullish wave, and thus the 1,630% and 2,648% targets open up. This is also a possibility and there is nothing wrong with aiming high up.
You can choose based on your preference. The way we do it, we accumulate when prices are low and instead of selling everything at one target, there is no need to be 100% right, we sell portions at each target. So we can sell some at 385%, if it keeps growing then more at the next target and so on.
Always leaving something behind just in case it goes higher... Cryptocurrency tends to surprise.
None of this information is to be construed as financial advice.
What I am writing is my interpretation of the chart.
What we call "bullish signals" points to this pair; the candles, the financial hieroglyphs, moving higher in the long-term. This "higher" we translate as certain percentages, numbers, and these numbers some people use to trade.
Whatever you do is up to you.
If you make any money, you can keep it, all of it. It is your decision, your computer, your actions; your win, your results.
If you lose any money, the responsibility is completely yours.
We are not and cannot be responsible for your actions.
You are an adult.
If you cannot accept risks, win or lose, then trading might not be for you.
If you can... Welcome to the Cryptocurrency market.
My name is Alan Santana.
Namaste.

LOOMUSDT | Trendline Break Signals Potential Upswing!!LOOMUSDT has recently broken the trendline, signaling a potential big upward move. While we anticipate this bullish momentum, a small correction could occur before the price takes off. Stay alert and trade safely!
LOOMUSDT (1D Chart) Technical analysis
LOOMUSDT (1D Chart) Currently trading at $0.06
Buy level: Above $0.056
Stop loss: Below $0.046
TP1: $0.07
TP2: $0.085
TP3: $0.1
TP4: $0.13
Max Leverage 3x
Follow Our Tradingview Account for More Technical Analysis Updates, | Like, Share and Comment Your thoughts

LOOMCross on Stochastic and currently inside a diagonal downtrend.
I expect when this trendline breaks, it will break heavy so no point waiting to get in on a retest.
Need to get in now.

LOOMUSDTLOOM ~ 4D ✅
#LOOM If you have Conviction on this Coin, you should get the lowest price at this time. at least for short term profits of 20%++

LOOM Breakout 1H Timeframe BullishLoom got a Structure Breakout of the 1H timeframe. We expect a strong resistance around the area 0,048 - 0,05. MACD signal just crossed, confirming the signal. With the demand increasing in the last couple of days for alt coins, expect a bullish move in the next couple of the days.

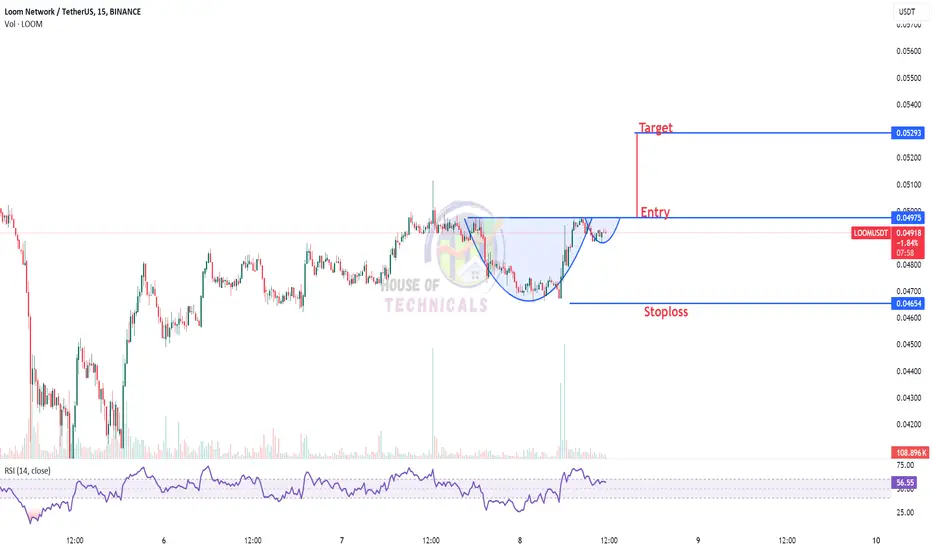
Cup & Handle FormationCup & Handle Formation on 15 mins TF
Entry at Breakout with a Proper Stoploss.
LOOMUSDT is on Bull Track nowLOOM has broken all resistance channels and now it on HIGH now. making HH and HL it can go upto 0.4

LOOMUSDT 2DLOOM ~ 2D
#LOOM Price bounces off this support block. if there is a chance of retesting, this would be a very interesting reversal.

Loom is bullish Loom is showing huge buy volumes and forming Inverse H&S pattern. Am so bullish for loom.

Loom chartLoom chart. This is done using an experimental method, the targets for the up movement are at the lines.
loomusdtLOOMUSDT long
............TEK3..............
if it breaks and confirms, it is possible to enter)), of not being patient

Now is a reasonable longWelp just like my last post stated, we had plenty of room on the daily to drop down to support. While I was hoping for a breakout upwards, we did drop out and have find some EMA support on the daily.
Hourly on the left is tight right now and primed for a move.

#LOOM Buy setup detectedHistory doesn't repeat itself, but it rhymes.
As you can see on the chart, a very similar setup has formed as in the past, which previously led to #LOOM rising by more than 1,000%. Let's see what happens this time.
*The trade is canceled if the daily candle closes below the indicator's lower line and the indicator remains red.

Continuing momentum into the weekend?Hourly tightening range setup with a daily breakout off support. If we are still in a bull market, this could keep breaking out upwards instead of pulling back!
HOWEVER!!!!!
There is alot of room for a pullback on the daily chart (right). Any leverage traders will be forced to sell/liquidate on an hourly break downwards as it will be a double digit % move. Still with plenty of room to stay bullish on higher timeframe supports.
