LPTUSDTHello snipers, nothing is impossible. In the one-day time frame, the price has returned above the 103-day moving average. In case of breakout and stabilization above the 103-day moving average, there is a possibility of price growth again to high resistances. All analyzes are only possibilities.
LPTUSDT trade ideas

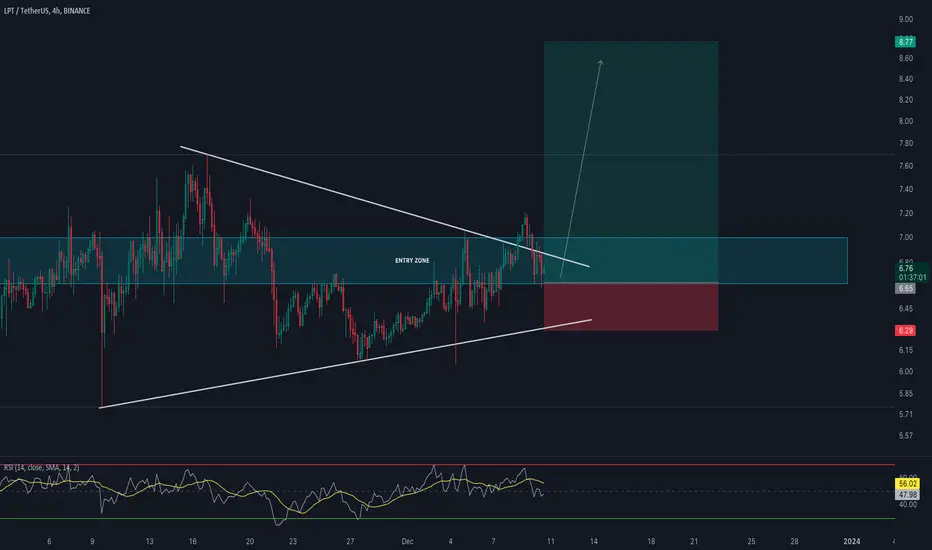
🚨 Trade Alert: LPT/USDT (3-5x)🚨 New Trade Alert 🚨
✅ LPT/USDT (3-5x)
📉 LONG Entry Zone: 6.64 - 7
⛔️ SL: 6.285
🔒 Breakeven Move: When it moves close to TP2
🎯 Take Profit:
Short Term: 7.060 - 7.12 - 7.20 - 7.35 - 7.45
Mid Term: 7.60 - 7.80 - 8.05 - 8.25 - 8.50 - 8.76
📝 Ensure you set entry orders to balance the trade's entry and aim to secure 30% of profits within the first two targets. Once profits are gained, adjust the stop orders to match the entry points or break-even levels.
⚠️ Disclaimer: Historical earnings cannot assure future outcomes. Is there a potential for risk? Certainly. The entire financial market is susceptible to uncertainties; any underlying factor or abrupt shift in market sentiment could overturn the current market trends and lead to losses. Refrain from undertaking undue risks that might jeopardize your financial stability. You are under no obligation to engage in this trade; kindly avoid the trade if you disagree with the trade analysis.
GIS TRADING®
LPTLPT currency has the potential to grow in the weekly and monthly time frame up to its recent limit
Check it yourself to buy

LPTUSDTI have taken a Long position on LPT, and this is my own idea. This trade is executed on Bybit.


#LPT/USDT is trying to break the Diagonal Trendline in 4-Hour TF#LPT/USDT is trying to break the Diagonal Trendline in 4-Hour TF!
UPCOM:LPT needs to clear PDH $6.425 resistance level to gain the bullish momentum.
#LPTUSDT is holding PWL $6.195 support level. Breakdown this support will be bearish.

Check LPT token statusCheck LPT token status
In the one-hour time frame, the RSI indicator is decreasing and it registers lower peaks.
On the other hand, the price is below the resistance zone and is still involved with the midline of its ascending channel.
If the candle closes below the midline of the ascending channel (confirmation candle), you can have a positive opinion on the short position.
Check it.

short LPTUPCOM:LPT broke through the support level and the ascending trendline. Decline to support level at 6.24$ is expected to happen.

LPTUSDT LONG IDEAlptusdt has breakout a falling wedge .
entry:6.49
tp1:7.21
tp2:8.11
tp3:9.02
sl:5.92

✴️ Livepeer Full Green Today (Short-Term Targets Inside)Livepeer has been on my radar for a while now and the chart has been bullish since June.
There is a set/group of Altcoins that bottomed 10-June, I call these the "strong ones".
Other Altcoins produced lower lows in August, September and some even in October, all part of the same corrective phase, the one that followed the initial early 2023 recovery bullish wave.
There is no difference at this point between a higher high and higher low when it comes to the bigger picture. We have the bullish breakout, a long correction followed by a new and stronger bullish wave.
👉 We are now in the next bullish wave phase, so we can see many pairs moving up.
➖ LPTUSDT is trading above EMA50, EMA10 and EMA1.
➖ The RSI is good at 66.
➖ Trading volume is still low but only because we are witnessing the calm before the storm.
The next move can happen really fast, big candles as in early August.
The breakout seems imminent based on the current chart.
The gray space on the chart denotes the support levels.
The targets can be seen green.
Thank you for reading.
Thanks a lot for your support.
Namaste.


LPTUSDTHello snipers, nothing is impossible. In the one-day time frame, the price is moving in a triangle. After hitting the ceiling of the triangle, the price overturns and approaches the upcoming support. All analyzes are only possibilities.

📊#LPT may rise based on a declining wedge📈➡️From the chart, we can see that we have made a substantial correction after achieving the goal of double bottom. In the process of adjustment, we have gradually been squeezed and formed a descending wedge structure. At present, our upper line has broken the descending wedge resistance line, but the closing price has not stood above the descending wedge resistance line, so we can judge that this breakthrough is just an attempt. Otherwise, it is considered a breakthrough success.
🧠If we look at it as a non-breakout success, then I would prefer to form a bottom-smiley bullish structure, and if this scenario is true, then combined with the inverted nature of the declining wedge structure, we have a higher probability of reversing higher.💯
➡️So now all you have to do is wait for the right opportunity to come along☕️👀
🔔If you think my analysis is useful to you, please don't forget to "like" me.✔️💯💪🍻
💕 Follow me so you don't miss out on any signals and analyze 💯

LPT possible longif we're able to hold this range's low, there's a potential to move a fractal higher...

LPTUSDTLPTUSDT is trading in symmetrical triangle pattern. The price is reacting well the support and resistance of triangle.
Currently the price is at the support of triangle where it is also forming a local support zone and seems like the price may break through the triangle.
If the breakout sustain to upside the optimum target could be 6 followed by 8
What you guys think of this idea?

LPT target 104h time frame
-
LPT has been consolidating for two months since reaching 9.26 in August. This consolidation structure is going to be a potential triangle pattern, which tends to be continuation structure.
If LPT can break above this triangle, we can set up a great trading plan, its risk to reward ratio is 4.
TP: 9.9~10.7
SL: 5.05

LPT is in a bearish waveOn the daily time frame, we have had a large diametric that has now ended the bullish wave F and we seem to be in the bearish wave G of this diametric.
The supply range is the offer range of the sell/short position.
I also specified the invalidation level, closing a daily candle above this level will invalidate the analysis.
It is better to set targets for yourself before reaching the green range, midway, and constantly reduce your volume. Because nothing is certain in the world of financial markets and we are dealing with possibilities
For risk management, please don't forget stop loss and capital management
Comment if you have any questions
Thank You

LPT/USDT SCALP (HIGH RISK)Hi Trader. I hope you have a good time. My short position on LPT which was opened at the price of 6.93 will be closed at the price of 5.76 and the long position will be opened. The stop loss of this analysis is less than 2% and the profit is around 10%. Accuracy Note that this trade on this currency carries a relatively high risk.
If you like this analysis, please follow my page.

lptusdt-mentoringa bit frontrunning
but still jumped into
in previous chart i wrote
"look for long if holds 5.64 area"

LPTUSDTIn this idea as usual I'm trying to wait until the price to hit the support ( yellow line) as u see in the screen.
I used Fibo + volume in this idea with the sl and tp as u see in the screen
This is not financial advice

lptusdt-mentoringlptusdt speculative view
lptusdt on weekly looks like made a higher low since it started the consolidation phaze
and now looks good for good long position trade at least to its previous ATH- about 14x
look for short if rejects 7.95 area
look for short if close under 5.42 area
look for longs if close above 8.27 area
look for long if holds 5.64 area
6.64 looks very promissing that the price will reach 7.95 area first
so i take long here
***
Tolerance will reach such a level that intelligent people will be banned from thinking so as not to offend the imbeciles- F.M.dostoyevsky

lpt on verge of massive breakout seems like lpt has already bottomed out and getting ready for massive breakout
formed descending channel in 2days timeframe and testing trendline expecting breakout soon
incase of successful breakout expecting 250 to 280% bullish rally

LPT Short Trade
Disclaimer:
This is not financial advice. I am not a financial advisor and I am not responsible for any financial losses that you may incur as a result of following my advice. Please do your own research before making any investment decisions.
Fundamentals:
LPT is a utility token that powers the Livepeer decentralized video streaming network. Livepeer allows users to stream video content to a global audience without the need for a centralized server. This is made possible by a network of nodes that provide computing power and bandwidth to the network.
LPT is used to incentivize node operators to participate in the network and to reward users for contributing to the network. LPT is also used to pay for transaction fees on the Livepeer network.
Recent news:
Livepeer has announced a partnership with Theta Labs to integrate Theta's streaming technology into the Livepeer network. This will allow Livepeer users to stream video content to a wider audience and at higher quality.
Livepeer has also announced a partnership with Bitmovin to integrate Bitmovin's encoding technology into the Livepeer network. This will allow Livepeer users to encode their video content more efficiently and at higher quality.
