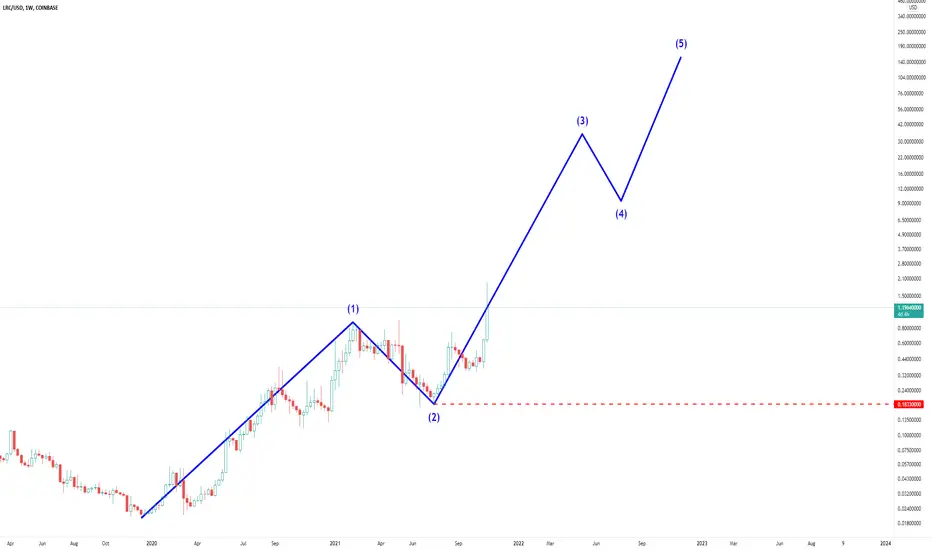
LRC 200% - 400% Ready For ProfitWe're ready for the next ascent. Minimum two hundred percent profit, maximum four hundred percent profit expectation. Good luck.
LRCUSD trade ideas

Anatomy of a $HITCOIN Launch and trying not to get BURNED!For those late night cryptosphere observers, we can sometimes see rockets at night. This one might fly 5 sec, 5 min or 5 hours. Charts will the state of the bulls and bears to either get rid of this shitcoin before it explodes. $hitcoins are long-shorts. Yes, you might his the jackport but otherwise, you can expect they before the greatest thing, then die off. Sometimes, the "rug pull" happens faster than others. You might end up with an amazon.com or a pets.com after the spectacular .com crash. 20 years later, here we are again it seems.
Well cryto in the form of well managed Bitcoin and Ethereum is safe heaven. In this tutorial, I will attempt to show from the launch detection to the hopeful exit.

LRC Bullish Pennant V2LRC Bullish Pennant V2 - 4hr candle.
I don't have much experience in TA, so please let me know if you have any inputs.

Potential bullish pennant forming on LRCCould anyone please confirm if this is a bullish pennant? I'm very new to TA, and would love some input. Thank you.

a new normal? LRC has recently had a 300%+ move!
(following leaked news about a partnership with gamestop to release a line of NFT's.)
As we've said in the past the tech is there.
Things to note / look out for:
- Loop can potentially have another pump in the near future but a much healthier option is for LRC to adjust to an evaluation of over $1. It's likely that the price will be channel driven horizontally for a few weeks.
- LRC has yet to have a daily close above $1.50.
- LRC's highest weekly close is $1.335, we can potentially close above this and put in a new ATH weekly bar close.
- If the GME + LRC news was only a leak, imagine what the craze would be like once the official news is out. LRC is a smaller project that is yet to even put in a new ATH (prior = 2.50 - 2.85 /depending on the exchange) which the majority of established projects have already done this cycle. Sticking with my previous price predictions of $6 - $8 for now.
I'm feeling bullish ;)

Loopring Reaccumulation LRC approaching the reaccumulation apex of the triangle. Look for further gains if/when this happens, with the 1.618% Fibonacci as the ideal take profit or liquidation level.
My entry is the yellow horizontal ray. Good luck and safe trades.
*Full-time Wyckoff VSA cryptocurrency investor and swing trader since 2017. I regularly seek out the most lucrative swings on all major crypto exchanges.
All my charts are clean, straightforward, and easy to follow. No junk, no needless indicators, just solid volume spread analysis ( VSA ) and modest 'take-the-money-and-run' Fibonacci target zones.
I go after the runners and big money. My win rates are between 80-85%. Follow me on TradingView and see for yourself!
I review over 300 coins & tokens daily and handpick all the runners myself (no bot signals). Good luck and safe trading to all.
** Not financial advice. Trade at your own risk.

LRC Looks prime to test previous ATH ($2.51)Good afternoon traders!
Just a little bit of fibonacci levels here, LRC is currently presenting a potential bull flag following the breakout of the falling wedge. Stop loss is set just a few percent below the 0 level, with my average entry at 1.073.
A solid entry point seems to be a close on the 15m above this current fib level, with adequate volume and momentum. Looking to see Loopring push up to it's previous ATH being $2.51 with the GameStop NFT marketplace news expected to drop shortly. I currently don't have any targets if/when we break ATH, I want to see how it plays out.
Good luck traders!

Loopring Bull Signal - Massive RSI SpikeLoopring Bull Signal - Massive RSI Spike seen on the 15 minute chart at the beginning of each leg of the ongoing long term bull run. With heavy positive public exposure with the ongoing GME situation, Loopring will be getting massive buying pressure as GME continues to loom in the background. With an announcement of partnership rumored soon, this is likely a conservative estimate.

Time for sleeping LRCUSD to wake up• Just a chart to show the similarities between this and the previous bullrun for LRCUSD.
• LRCUSD has been in a parallel channel on the weekly since Mar’20.
• LRCUSD reached the top of this channel in Feb’21, and its bottom in Jul’21.
• Using the same fib levels, and similarly applying from peak of bullrun phase 1 to bottom of mid-cycle consolidation phase, the same fib levels hit the top of the channel at approximately the same time (alts-ETH) are projected to peak.
• Hodl till $4.34 for up to a 12X potential.
• Watch weekly RSI; volume should pump when weekly RSI hits ~70.

Don't Be Fooled.It's not going to be easy for everyone to pull the trigger on this...as just like SAND people are thinking it's a pump and dump > make no mistake it's not. This is one of the most perfect blends you can get where crucial fundamentals meet TA. Layer 2 zk-roll ups are going to be an integral component to the ETH ecosystem (this is Loopring), They're better than optimisitc roll-ups because they're faster simply put. I believe this is going to go up a lot and we're at the start of one big uptrend where novices will attempt to call tops every new high and trade for small gains thinking they're genius's...only to be worse off.
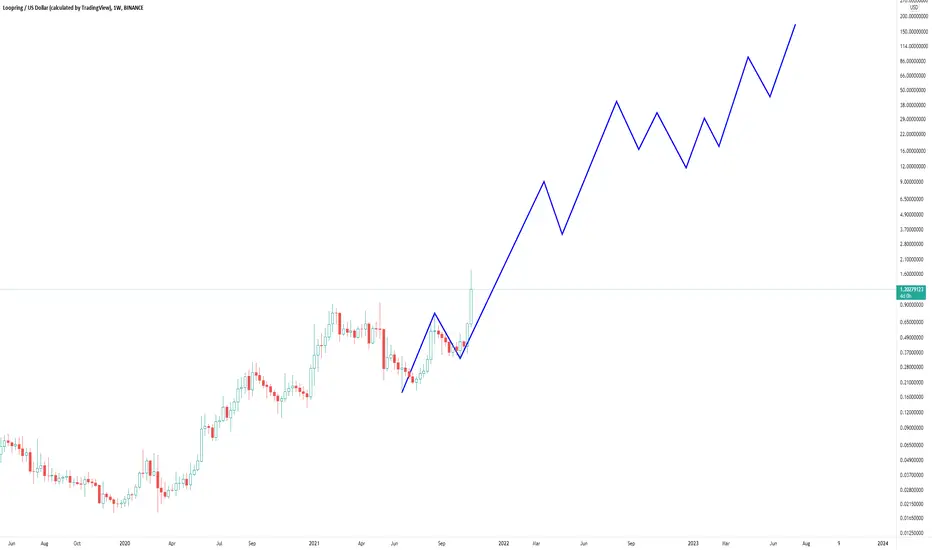
Visualizing The Future.I truly believe this is the start of something great as layer 2s value will be realized in a big way > combined with the explosive growth of the ETH ecosystem. Many will look at this chart and dismiss it even being possible and they may be correct but I've done these projections of real Fib ratios not just pulling numbers out of nowhere, They're derived off previous moves and have a natural rhythm once those moves have been confirmed (they have).
Loopring Bullish Base PatternPrice floor forming around .35. After accumulation is complete, then price can be marked up to $1 possible next month

Market Cipher Long Signal on LRCthere was a valid re-entry at 1.058
as the blue wavetrend oscillator on the market cipher indicator crossed above the green rsiMFI (money flow index)
same pattern worked out yesterday on SANDUSDT
and two days ago on MANAUSDT
its a method to enter a low risk position the biggest gainers of the prior day.

LRC LOOPRING ready to hit $1.00 by breaching 0.81Buckle up for this coin to blast thru 0.81 level and quickly get to $1.00 Ever since that breakout at $0.50 there is no stopping on this one.

Loopring currently teasing massive inv head & shoulder breakoutThe breakout is by no means confirmed yet. However once it is it can climb all the way to $1.93-2.00! This is what the pattern looks like on a weekly chart, and I wouldn’t be surprised i it was more o a 2 week chart pattern. I so this may take multiple weekly candle closes above the neckline before it triggers the breakout. I think loopring’s all time high was somewhere around $2.50 or so so it is definitely possible for it to reach these levels again and also very possible to hit a new all time high some time in the not so distant future. Keep an eye on this one.

LRC Analysis (11/01/2021) This is an analysis I ran yesterday to understand the behavior of the LRC coin.
LCR coin has shown a steady constant increase in the last week. this price increase differs from other altcoin prices increase since it has been steady and the cost has not dropped significantly after a rise.
therefore, my conclusion on this coin is that it has stabilize its position and that it will increase its value steadily for the following months. Thus, probably a good option for long term investment.
***I'm Not a financial Advisor, please research on your own***

$LRCTriangle breakout TP is around $1.3 but I think it will pump to 1.65 at least and in the best scenario breakout ATH at $2.5+

❌LRC SHORT We point out the spot to buy. Now is time to sell. LRCUSD SHORT after 70% up in the last 24h

LRCUSD SHORTWe point out the spot to buy. Now is time to sell. LRCUSD SHORT after 70% up in the last 24h

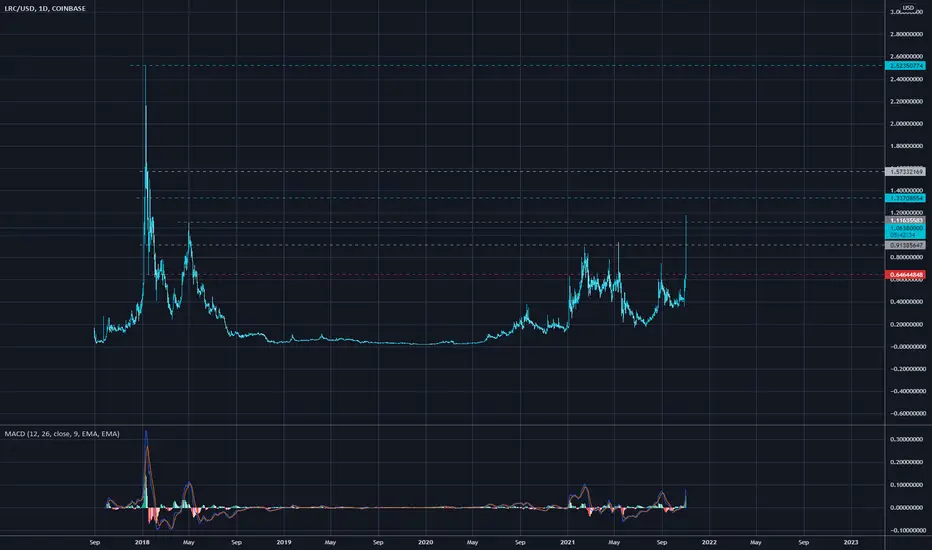
LRC Range breakout ? LRC has been in range for pretty much the whole year between 1$ area and 20ct.
Today it seems that prices are going for a break of this range, the MACD in Daily and Weekly are supporting for this plans.
I would wait here to confirm the breakout with closure of daily candle and then wait for a consolidation with prices finding support of the 1$ area.
To me, in my opinion it is too late for buying here as entries were well bellow current prices. But the setup looks good and have some great potential with 1st higher target at 2$. Aggressive traders could take a long here to play the momentum.
If not already in the market we'll need some patience before going long, for the ones already in, enjoy the ride and don't sell for now if you have mid to long term plans.

LRC bout to rageLevels are posted, Grey are soft levels, Red is the weekly support level Blue is the weekly resistance and Top blue is ath
Ode to the LRCIt's not quite 1993 yet and this dog looks hungry.
Possible breakout occuring and we could see a good upside in trade of a widening formation with a cup and handle.

BULLISH LRCLRC: On the big picture, we look like we are beginning our breakout to 1-1.30. On the the smaller time frame, we are still breaking out to .75
