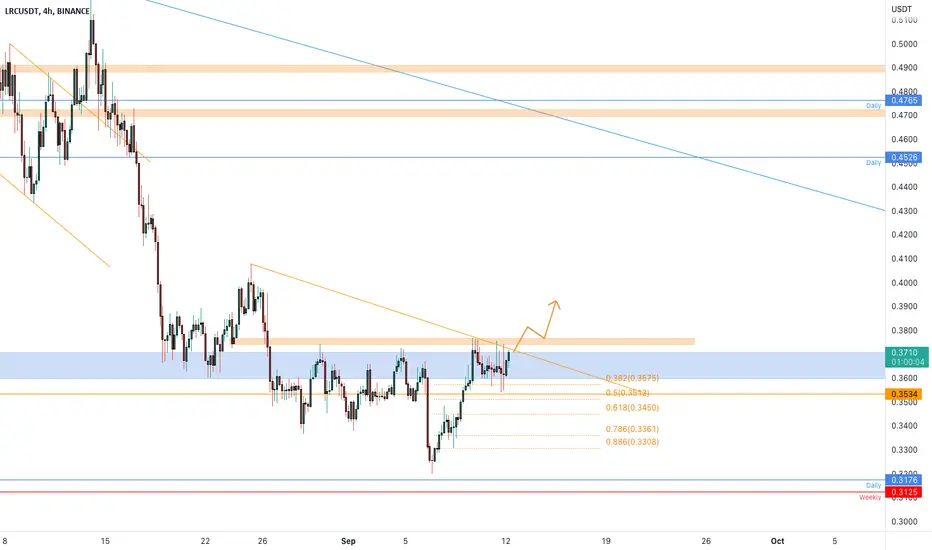
LRCUSDT is testing the resistanceThe price retested the 0.382 Fibonacci level, after a bullish impulse from the daily support
Now the price is testing the key levels, daily resistance and 4h dynamic and static resistance on the 0.38$ area
How to approach it?
IF the price is going to have a breakout from the resistance and retest it as new support, According to Plancton's strategy , we can set a nice order
–––––
Keep in mind.
🟣 Purple structure -> Monthly structure.
🔴 Red structure -> Weekly structure.
🔵 Blue structure -> Daily structure.
🟡 Yellow structure -> 4h structure.
–––––
Follow the Shrimp 🦐
LRCUSDT trade ideas
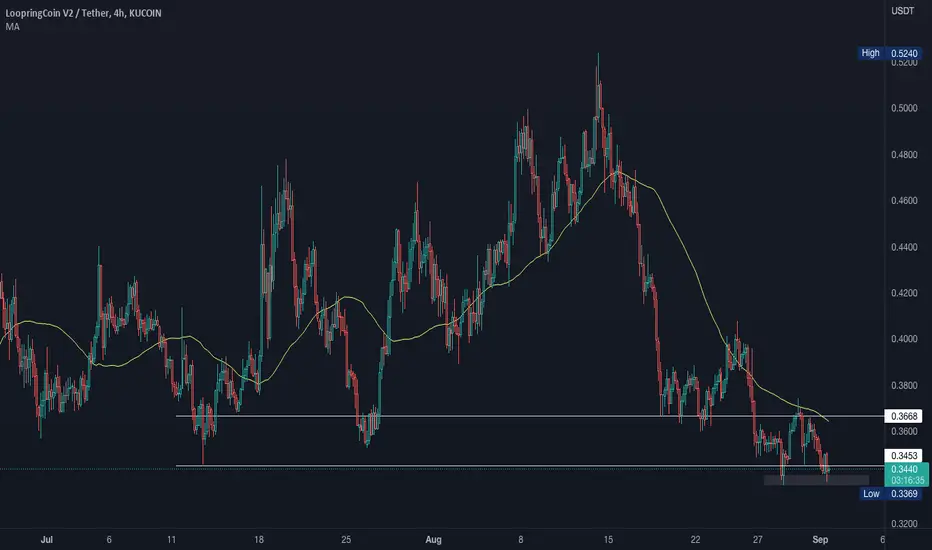
LRCUSDT wants the breakoutThe price is testing the weekly support where the market got the liquidity.
Now the price is trying to have a breakout from the daily resistance after a double bottom
How to approach it?
IF the price is going to have a breakout from the resistance and retest it as new support, According to Plancton's strategy , we can set a nice order
–––––
Keep in mind.
🟣 Purple structure -> Monthly structure.
🔴 Red structure -> Weekly structure.
🔵 Blue structure -> Daily structure.
🟡 Yellow structure -> 4h structure.
–––––
Follow the Shrimp 🦐

#LRC long ideaHello dear Traders,
Here is my idea for #LRC
Price finds support at monthly pivot S1 line.
Wait for daily close above the yellow trigger line (previous month high) to enter trade.
Targets marked in the chart (black lines)
Invalidation level marked with red line
Please feel free to ask any question in comments. I will try to answer all! Thank you

LRCUSDT Critical and Looking to BTCUSDTKUCOIN:LRCUSDT
LRC is at major support that is approached via descending triangle. If support breaks and retests local low, possible opportunity to Short LRC to 0.1905 - 0.2312 zone. However, Long LRC on bounce off support via a possible double bottom with targets to 0.3660.
If you liked this idea or if have your own opinion about it, write in the comments.
The information and publications are not meant to be, and do not constitute financial, investment, trading, or other types of advice or recommendations.
LRCusdtLRC good work when market going up but now come bottom and this triangle is long time going down
remember this targets for mid adn long time
i try show u close targets but remember when btc back up again altcoin can move
GL
EntryPoint:
0.3264
Supports:
0.2909
0.2477
0.2021
0.1817
0.1594
Resistance: (remember for short time can set this for targets):
0.3861
0.4762
Targets:
0.5501
0.7761
1.0270
mid time:
1.3568
2.0156
3.3313
for HODL: (this is risky but for years is ok)
6.3381
can see 2 trgets on chart but i think better before that you sell and buy others ALT
can happen but now market going down for btc
on chrt can see pattern

LRCUSDT Loopring - CRAZY?? +1000% Potential*Hi Traders, Investors and Speculators 📉📈
Ev here. Been trading crypto since 2017 and later got into stocks. I have 3 board exams on financial markets and studied economics from a top tier university for a year. Daytime job - Math Teacher. 👩🏫
Another altcoin that I am bullish on for the near future, is Loopring LRCUSDT. This microcap is trading at 1000% under it's ATH, and considering the fact that we are evidently trading in the accumulation phase, between now and perhaps a little lower would make for some great distributed entry points.
Want to know a little more on how to do distributed entry's / dollar-cost-average? See HERE:
*Before you leave a comment, please make sure to watch the video all the way to the end, as there are some "t's and c's" mentioned about the upside potential.
I hope you enjoyed this post today! Please give us a thumbs up 👌
_________________
👀 Follow us here on TradingView for daily updates and trade ideas on crypto , stocks and commodities 💎
👍Hit like & Follow 🔔
We thank you for your support !
CryptoCheck

LRCUSDTHello Crypto Lovers,
Mars Signals team wishes you high profits.
This is a one-day-time frame analysis for LRCUSDT
There is R2 that used to be a support area. R1 is our resistance line that shows the price was not able to rise at some points. And S1 is the support area and you are able to observe the well support of the price in it. Accordingly, we have the price fluctuating over S1 and we expect a fall for it to this area. By reaching here, we should wait for some confirmation candles in order to rise and when this happens, we predict an increase to happen toward R1 for the price by considering our long position. In case the price loses the support at S1, surely more decline is waiting for it.
Warning: This is just a suggestion and we do not guarantee profits. We advise you to analyze the chart before opening any positions.
Wish you luck

another panel These are another four coins that are showing the same pattern -- If it's indicative of what's happened already, than I think we're gonna see a bit of a push here.

LRCUSDT 1WLoopring has been touching this trend for a long time on the weekly chart and starts the bull run. Will it succeed this time?

LRCUSDTA strong downtrend , the formation of the flag figure has ended , this figure has been broken , its retest has occurred .
The tool will go below. short entry by pattern

LRC/USDT buy trade setupToday we had a big downside move. The medium-term trend is turning from bearish to bullish and right now it can be a good time to take some risk.

not financial advicethis post is for myself to track my own ideas; brief description not really needed here, just filling up character limit... thanks trading-view
but yeah
idea is a projection of a sin curve w/ tilted angle;
don't know what candles will say;
look like inflection point on 200 Day SMA
if BTC relief rally --> ETH rally --> ALTS rally as rising tide lifts all boats; not fin. advice

LRC/USDT is about to boomWe expect LRC to bottom today or tomorrow, then a new upside wave should begin.

Loopring next targetSupport/resistance levels:
1.04
1.23
1.362
Mirror level - 1.23
If you position long, the next targets can be:
1 - 1.23
2 - 1.362

$LRC moonLRC on its way to new ath.
i think this coin will touch the yearly resistance for the 3rd time very soon

Loopring (LRC) Price Prediction 2022Loopring (LRC) Price Prediction 2022
Loopring (LRC) holds the 90th position on CoinGecko right now. LRC price prediction 2022 is explained below with a daily time frame.
The above chart of Loopring (LRC) laid out a Descending Channel. Descending channel also known as the falling channel. A descending channel is formed by two parallel trendlines. The upper trendline, which joins the highs, and the lower trendline, which joins the lows, run parallelly downwards. This pattern is the characteristic of a bearish market.
Currently, Loopring (LRC) is in the range of $ 0.4805. If the pattern continues, the price of LRC might reach the resistance levels of $ 1.3780 ,If the trend reverses, then the price of LRC may fall to $ 0.3232
Loopring (LRC) Support and Resistance Levels
The chart below shows the support and resistance levels of Loopring (LRC)
From the above daily time frame, we can clearly interpret the following as the resistance and support levels for Loopring (LRC).
Resistance Level 1 $0.5105
Resistance Level 2 $0.7238
Resistance Level 3 $1.0925
Resistance Level 4 $1.6536
Support Level $0.3372
LRC /USDT Support and Resistance Levels
The charts show that Loopring (LRC) has performed a bullish trend over the past month. If this trend continues, LRC might run along with the bulls overtaking its resistance level at $1.6536.
Accordingly, if the investors turn against the crypto, the price of Loopring (LRC) might plummet to almost $0.3372 , a bearish signal.
Short Note :
Breakout Level : $0.4845
Target : $1.3780
Stop Loss : $0.3232
Happy Trading !!!!

LRC resistance 24hHello guys, as you can see once we reach and breakthrough 0.51 and
we hold it clean, is very bullish and the chart has good signs in entry
but after we reached 0.51 and the coin has very good project .. please
I'm happy to receive your thoughts

Loopring shortLoopring bounced off the upper boundary of ascending channel. Bearish movement to support level at 0.3965 is expected to happen.


LRCUSDT , ACCUMULATION BULLISH RALLY?
Hello Traders,
Before we start to discuss, I'll be so glad if you share your opinion on this post's comment section and hit the like button if you enjoyed it.
- Looking at how LRC is moving on the 1D time frame chart is tell us that the price is about to breakout from the upper trendline resistance with a decent amount of volume , price was accumulating for a decent time on
support level 0.3300$ - 0.3600$ which tell us that buyers have an interest to take the price higher towards the nearest strong resistance level 0.5200$-0.5600$ and progressively higher
- If buyers succeed to break the trendline then we might retest it and go from there , we can ride the breakout or wait until it's confirmed and take a long position from there with a suitable risk to reward ratio , please
manage to put your stop loss far from the market noise in order to avoid stop loss hunting.
- If buyers failed to breakout then we can have a small pullback towards old support level 0.3300$

$LRCis it time to send everything ?
ranging between the blue lines
2 weeks ago it poked above where it lost support from or the LH and now imo has retraced and ready for the red line which is a shade under the 200 on the daily .
move should happen after weekly close or just before it .
invalidation is below blue line .

Trend line analysis
( #LRC_USDT > 1D )
The 255-day Down Trend line has been reached. I see it as a coin that has a great chance to get a parabolic move. The blockchain that this coin is made of is very useful, so it has attracted the attention of investors. Therefore, if this breakout occurs with a good volume, there is an opportunity to take a futures trade and spot coins.

#LRCUSDT #CryptoEN
0.4318
0.3608
TP :
TP1: 0.4676
TP2: 0.5535
TP3: 0.6414
TP4: 0.6766
TP5: 0.8151
TP6: 0.8568
TP7: 1.18
TP8: 1.35
TP9: 2.31
TP10:2.56
SL : 0.44 .. 1 day close
