LRCUSDT trade ideas

LRC/USDT - Pending sell order #FUTURES x20Pending sell order.
After reaching the price of 0.9295, open a position for 2% of the deposit, with 20x Leverage
Target and stop loss indicated on the chart

LRCUSDTIf the dynamic resistance breaks, it can grow 1.965613 in that range, we should wait for the price reaction, and if the dynamic resistance does not break, we should wait for the price correction to the range of 0.731310 and then to the range of 0.531501 and the reaction to the dynamic line.

LRCSmall hourly formation potential to break if it does looks like a head and shoulders, which would take us to 1.6x area.
If not we come back to the base.

LRC longLoopring is bouncing off the support level which is alsi matching with the Fibonacci 0.5 retracement level. Bullish trend is expected to continue up to 1,22$

LRC USDT Binance - go to the 3-4 USDT at this 10-20 daysLRC USDT Binance - go to the 3-4 USDT at this 10-20 days

Lrc trendsWe still haven't come back to touch major trend yet. Everyone feels very bullish right now, but we Still have a strong possibility of rejection here.

SHORT - LRC dump to 0.76SHORT - LRC dump to 0.76 with technical analysis and fibo
look at to chart...
1ST Target : 1.21
2ND Target : 0.76

SHORT - LRC dump to 0.76SHORT - LRC dump to 0.76 with technical analysis and fibo
look at to chart...
1ST Target : 1.21
2ND Target : 0.76

LOOPRING LONG SETUP LRC/USDTLoopring currently sitting down at the .886 and at the POC of the entire range and printing HL and HH
for a market structure change .
I have measured some regions on the chart pulling Negative Fibs and Standard Fib retracement tool for areas of confluence
although I have kept some info at a minimum to keep the chart looking clean .
I decided to take away all the Daily/weekly levels except for a few as these areas will add to the resistance at those regions.
Not all levels are displayed again just to make it easier to read so pls do add your own levels if need be .
FIB Speed fan also used from High to Low and aligns very well with our areas of confluence that are highlighted.
As seen in the chart I have outlined 3 regions for taking profits but its your responsibility to determine your own
invalidation and entry .
If BTC decides to drop then no alt coin will hold regardless of how bullish the asset is so ensure to follow your Risk management plan
and have awareness of BTC.

Teaching trade!!!Hello again my friend....most of new traders have some troubles on determining s/r zones and I have marked some trading strategies for teaching... picture is clear and don't need explain

LRC Potential Formation ?LRCUSDT | 4H Timeframe
Scenario potential, all things being equal.
Follow @cryptonkidd for my picks and trades.

LRC---USDTDue to the upward trend line and the reversal of the price from that line, we expect to have a resistance area before the price increase and enter the long position.


$LRC LRC ABC correction targets (potentially completed Cycle I)an ABC correction taking place
should get rally bounce once BTC completes projected wave 1 of ABC.
From there I'd suspect further downside for LRC to resume bearish sequence in potential WXY for a larger degree correction while BTC is completing cycle II correction.
NFA . DYOR.
Just sharing ideas. Feel free to leave comments, hit like to show support and if you manage to hit targets from these ideas, please let us know.
Tips are always welcomed :)
Thank you for viewing, sharing and safe trading to you all!

CHART PATTERN ANALYSISseen a pattern always looks nice, because to a point we can clearly see the direction at which price is about to move. In point we see price fall an found a support and with that formed a double bottom and move to it's neckline. the point at which we focus on what next, if it breaks the neckline we see an upside in price.

LRCUSDT H4 LRCUSDT H4 harmonic formation expectation, I predict it to reach 1.55 first, I predict it will fall to 1.10 after 1.55 level. I wish you good luck. The investment information, comments and recommendations contained herein are not within the scope of investment consultancy. Investment consultancy service is provided individually, taking into account the risk and return preferences of the individuals. The content, comments and recommendations contained herein are of a general nature, which are not in any way directive. These recommendations may not be suitable for your financial situation and risk and return preferences. Therefore, making an investment decision based solely on the information contained herein may not produce results in line with your expectations.

Loopring 2022 Buy OR SELL Signal FORECAST NEXT DALLY TREND CHART(LRC) Loopring 2022 Buy OR SELL Signal FORECAST NEXT DALLY TREND CHART
If you like this analysis, smash the "like button" and leave a comment below to share your thoughts
or let me know what crypto you want to see!
Trading is a reflection of yourself. Learn more daily and be ready for every opportunity.
Have a nice trading!

IMPORTANT LEVEL FOR LOOPRINGLoopring is going down from $ 3.85 and found the deep around 0.64.
Now it is trying to break daily channel upside which is the level $ 0.92
If it can pass that level it will pump very quickly.

Weekly Still HoldingWeekly still holding right now.
Looking for good news to bump this up.... but we are still waiting on Bitcoin. It looks more and more like we are waiting for bitcoin to give the thumbs down for more pain.. or two thumbs down for max pain (Full bear market).
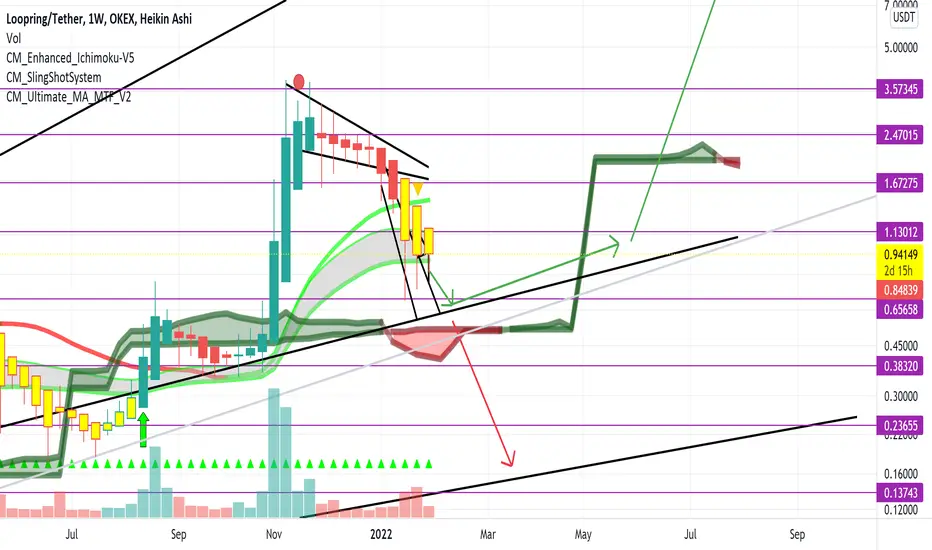
58 cents or 1.68Looks like a new trend is beginning to form and will hold up for a while longer if we break here now. If not expect 58 cents to be the final bottom bounce point which is its long term trend line.
We must hold that long term trend or we are 100% in a new, longterm, bear market and we could see LRC plummet another 75%.

Bullish Loopring traingleClassic triangle play here as will needs to retest before going any higher
BTC is currently at resistance so this may affect the play

Loopring (LRC)On the above 1-day chart price action has increased 600% since late July, amazing. A ‘incredible sell’ signal has now printed indicating the probability of further upside is limited for the time being.
Is it possible price action increases further? For sure.
Is it probable? No.
A breakout above $1.44 could occur, in that situation look for an exit around $2.10.
As the correction takes place look for support around 86 cents and then 66 cents. Historically speaking the 50-day EMA (blue line) has offered strong support when price action was in a uptrend. It is currently at 70% correction away!
Good luck.
WW
