$LRCUSDT best time to hold and wait is now!I'm very bullish here. In my 7 years of trading experience, I've seen the same pattern as LRC many times, and this could be another time to enter and wait. Thank me later.
LRCUSDT trade ideas

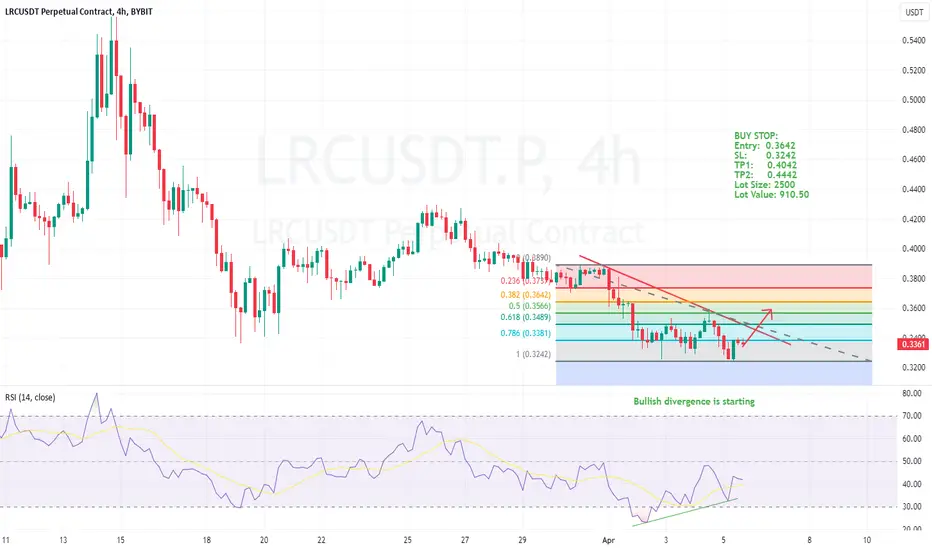
LRC buy/long setup (4H)From where we placed the green arrow on the chart, we have a bullish pattern on the chart.
This pattern is diametric or triangular. In both scenarios, the price can move from the green range to the red box.
The targets are marked on the chart.
Closing a daily candle below the invalidation level will violate the analysis.
For risk management, please don't forget stop loss and capital management
When we reach the first target, save some profit and then change the stop to entry
Comment if you have any questions
Thank You

LRCWe've seen crazy bounce backs into patterns before, but I think social sentiment is so poor right now we also break 8.5c and head towards 5c. Its snowballing very quickly at this point.
Below 8.5c Ill look towards other projects and put my time elsewhere until, or if, lrc has some drastic release or real Tangible news. This false hyping is poorly impacting the project.

LRCBuy when theres panic? This one is a pretty crazy buy thats for sure.
Look at this very significant area that lrc is poking right now. Do you take your gamble on this sinking L2 here or are you waiting for 10,9,8,2 cents?
Are GME and LRC completely separated? Could LRC have any other NDA right now? What does LRC have coming in the next 6 months, or next year, that looks promising? Are you going to jump onto any rumors and buy again? Has the hack been priced in? Any potential large LRC listings? What is their time expectancy of 'byob'? 5 years, 15 years? Is this a legitimate or even achievable dream legally? Socially?
Feels like a shot in the dark while handicapped with no hands at the moment to me. I need more information.
Until then I feel I stand a better chance buying lottery tickets.

$LRCreclaim happening
stop 10% away for now
lets see what we get
deviate back shall hop off
long term swing

LRC/USD Local trend. Wedge. Capitulation zone 17 08 2024Logarithm. Time frame 3 days (no less).
The price is in the capitulation zone in a local descending wedge, after breaking the long-term horizontal channel. The percentages are shown from the key zones for clarity.
Linear without market noise.
Main trend (most of the price chart history).

LRC/USDT Main Trend 08/17/2024Main trend (the most visible part). Logarithm. Time frame 1 week. Loopring is an open protocol for building decentralized exchanges.
The price is in the capitulation zone in a local descending wedge, after breaking the long-term horizontal channel. The percentages are shown from the key zones for clarity.
The chart also shows the dynamic support/resistance zones of the Gann fan (bullish and bearish).
It is worth noting that the price is at a significant profit of crypto funds 4-26X, but most of the volume has already been redistributed.
Linear for clarity of the trend.
Secondary trend

LRC USDTLRC is currently in a bearish trend and has been moving within a descending channel for approximately 154 days. The chart clearly shows the price making lower highs and lower lows, respecting the boundaries of this channel.
Everything is on the chart

jeffans: LRCUSDT bold 14x global idea during alseason 2024+LRCUSDT bold 14x global idea.
See the first step of this long, long, literally long way in my ideas on 1D timeframe.

Uncharted trading areaCould be hitting the bottom of a larger form that you can kind of see but i havent drawn to keep it less cluttered.
Pretty risky to trade it here not knowing what pattern we are going to follow.
Better to wait to see if 13 cents is the new bottom and this current pattern is stronger than the larger whole pattern.
I believe crypto is way overdue for alt relief, but total capitulation is very realistic given economic and global events. This is why I'm choosing to wait for 13 cents.

Loopring Analysis: Last correction before rocketing!Loopring is now down almost 95% from its previous ATH and is about to reach another low, presenting a new buying opportunity in the market. The support level at $0.10 is an ideal buy zone for LRC, with an ultimate target of $6, IMO.

The last bullish chance of LRC in Mid term !Hi.
COINBASE:LRCUSDT
LRC is in a Bullish phase by Ascending Triangle & Cup & Handle.
- You can look for reasons to enter according to your own personal strategy after approval.
❗ Note that if the Triangle is broken down with the power of descending candles, our analysis will fail.
Traders, if you liked this idea or have your opinion on it, write in the comments, We will be glad.
_ _ _ _ __ _ _ _ _ _ _ _ _ _ _ _ _ _ _ _ _ _ _ _ _ _ _ _ _ _ _ _
✅Thank you, and for more ideas, hit ❤️Like❤️ and 🌟Follow🌟!
⚠️Things can change...
The markets are always changing and even with all these signals, the market changes tend to be strong and fast!!

LRC BUY Based on the provided chart for LRC/USDT on a 1-day timeframe from Binance, here's a detailed trading plan:
### Entry Point
- **Entry Zone**: Between 0.2358 and 0.2521 USDT
- This range represents a significant support zone where the price is likely to find buying interest.
### Target (Take Profit) Levels
- **First Target (TP1)**: 0.3383 USDT
- This level is around the 61.8% Fibonacci retracement, which often acts as a strong resistance.
- **Second Target (TP2)**: 0.3792 USDT
- This level is a higher resistance zone and aligns with the 50% Fibonacci retracement.
- **Third Target (TP3)**: 0.4212 USDT
- This level corresponds to the 38.2% Fibonacci retracement and is a strong resistance area.
### Stop Loss
- **Stop Loss**: 0.1994 USDT
- This stop loss level is set below the support zone to protect against a deeper downside move.
### Key Levels and Observations
- **Resistance Levels**:
- 0.3383 USDT (61.8% Fibonacci retracement)
- 0.3792 USDT (50% Fibonacci retracement)
- 0.4212 USDT (38.2% Fibonacci retracement)
- **Support Levels**:
- 0.2521 USDT (current level within the entry zone)
- 0.2358 USDT (lower end of the entry zone)
### Technical Indicators
- **RSI**: Currently around 42.48, indicating a neutral to slightly bearish market sentiment with no strong overbought or oversold conditions.
- **Volume Profile**: Shows high trading activity around the entry zone, suggesting strong interest and potential support.
### Chart Patterns and Analysis
- **ABCD Pattern**: This pattern suggests that the price has completed a significant move and is likely to retrace to a Fibonacci level before resuming its trend.
- **Volume Profile**: Indicates a significant volume around the current price level, which often acts as a support zone.
### Trade Plan Summary
1. **Enter** the trade within the 0.2358 to 0.2521 USDT range.
2. **Set Stop Loss** at 0.1994 USDT to manage risk.
3. **Target Levels**:
- **First Target (TP1)** at 0.3383 USDT.
- **Second Target (TP2)** at 0.3792 USDT.
- **Third Target (TP3)** at 0.4212 USDT.
Always remember to manage your risk appropriately and adjust your trade parameters based on market conditions.

LRCUSDT.PHello Trader BINANCE:LRCUSDT.P
high time frame 1 day - 4 hours price accumulation is quite long sideways bearish, but for the ltf there is a potential moment to be in the long area. I have determined the limit price, hopefully according to expectations for the future
entry area: 0.2517 - 0.2493
take profit 12%
stop loss 2.5%
Please add a comment and Positive feedback and constructive criticism are important to authors and the community.
Disclamer: Not Financial Advice

LRC broke the downsloping resistancehi traders,
Expecting an uptrend for altcoins within the next 2 or 3 weeks. LRCUSDT will participate in this uptrend too.
LRCUSDT broke the downsloping resistance. We can see bullish divergences and the double bottom pattern. Everything is suggesting more upside now.
You can buy now or wait for a pull-backs.
Stop loss below 0,22
target 1: 0,3540
target 2: 0,4294
target 3: 0,47

LRCUSDT.PHello Trader BINANCE:LRCUSDT.P
rising wedge area pairs lrc, for small resistance it is valid for rejection and breakdown towards the nearest support
take profit 13%
stop loss 3%
Please add a comment and Positive feedback and constructive criticism are important to authors and the community.
Disclamer: Not Financial Advice

LRC LOOKS BULLISHThis analysis is an update of the analysis that you can see at the bottom of this page, in the related analysis section
LRC Diametric seems to be complete. By maintaining the green range, it can move towards the targets.
Closing a candle below the invalidation level will violate the analysis
For risk management, please don't forget stop loss and capital management
When we reach the first target, save some profit and then change the stop to entry
Comment if you have any questions
Thank You

Chart 5 of 5: LRCUSDT.P: POSSIBLE TREND REVERSALLRC is probably reversing bearish trend to bullish with Dirvergence evidence.
lrcLoopring is in a bullish pattern in daily time
And it has relatively good support considering the upward trend in the above time
After the failure of the pattern and bullback, I imagine a good bullish line

LRC correction DONE? Possible 40% growth in priceLRC bounce upper supply is that enough? Honestly it's looking very interesting already
Already a possibility of DB on 4hrs TF now if getting that bottom seem like catching a falling knife to you wait 🥴 for the price to cross the neckline region. Honestly it's already due for a ride in price But DYOR

LRC Next Move: Grab the Bull by the Horns! 🚀 Loopring (LRC) Coin: A Quick Summary
What is it?
Loopring (LRC) is a cryptocurrency token that powers the Loopring protocol. This protocol is designed to help developers build decentralized exchanges (DEXs) that combine the benefits of centralized and decentralized exchanges.
Here's a breakdown:
Centralized order matching: Loopring uses an order book system similar to centralized exchanges, allowing for faster trade matching.
Decentralized on-chain settlement: Trades are ultimately settled on the Ethereum blockchain, ensuring security and transparency.
Recent News (as of March 26, 2024):
There aren't any major headlines specific to LRC in the very recent news, but the crypto market as a whole has seen a slight increase in the last 24 hours.
LRC Token Uses:
Transaction fees: LRC is used to pay transaction fees on Loopring-powered DEXs.
Staking: Users can stake LRC to earn rewards and gain voting rights in the Loopring DAO (Decentralized Autonomous Organization).
Deflationary mechanism: A portion of transaction fees are burned, which reduces the total number of LRC tokens in circulation over time, potentially increasing its value.
Disclaimer: I am not a financial advisor and this is not financial advice. Please do your own research before making any investment decisions.

LRC/USDT Long Projections (Bullish Projections) Based on the continuation of Bullish Momentum,
Looking Good to Me yet, Watching on all Timeframes. Approaching Important Support / Resistance Levels ....
I Personally Think we are likely to push at least to 0.43~ - 0.448 soon (Based on the continuation of Bullish Momentum!) on the shorter Time Frame...
Fun Coin Time, BTC is going to tank. Or pump again then fall on its bottom like a drunk dinner lady.
ETH All the way.
Happy Trading.
T.
Please Follow and comment.
Thank you.

LRC/USDT Targets based on Bullish / Bearish Momentum ....Still Bullish on LRC/USDT,
LRC Projections based on Bullish / Bearish momentum.
Still too early to tell just yet, Will be watching closely throughout the day ...
Much more clear line of direction this evening (UK)
Looking at the Daily T/F Starting to look Bullish Will have to wait for confirmation (Strong close above S/R) and continuation of trend.
