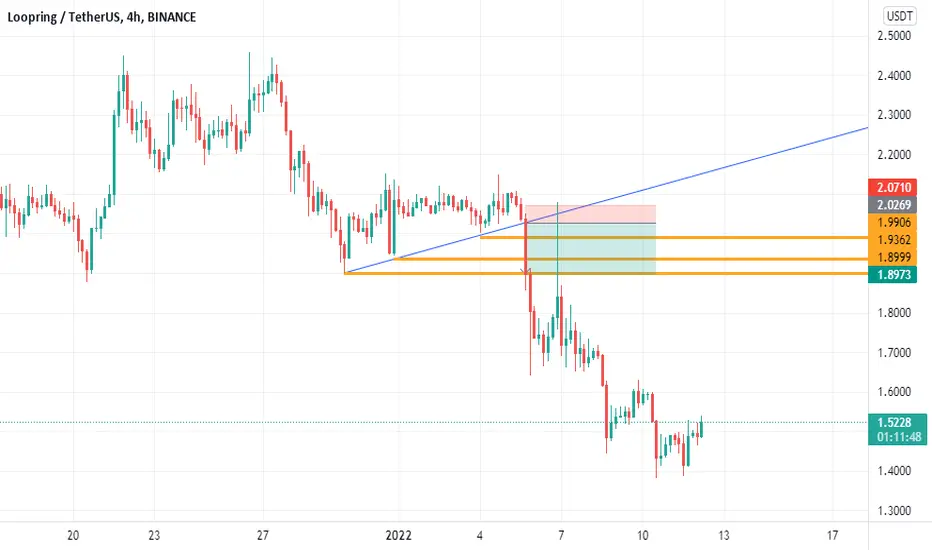
loopring----usdtDue to the breaking of the uptrend line, we opened the shorts transaction and targeted it
LRCUSDT trade ideas
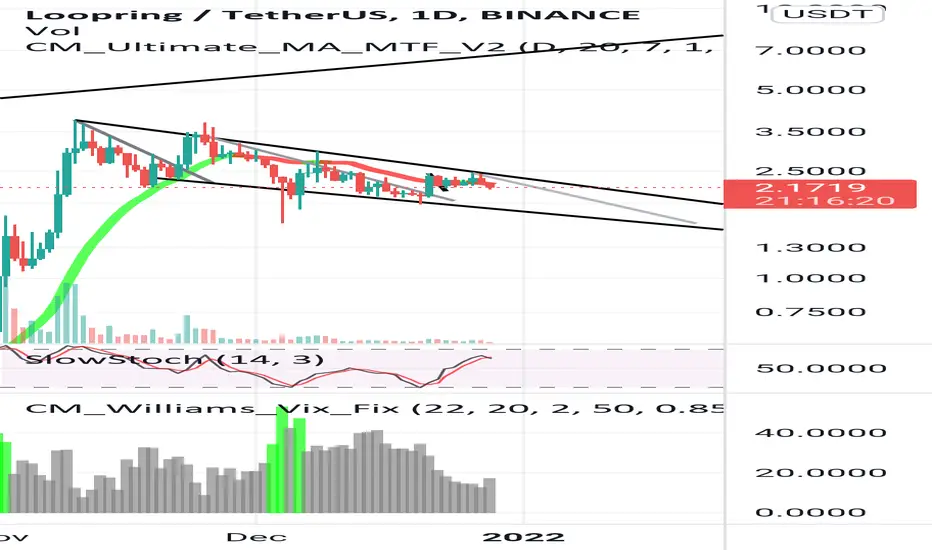
LRCThis currency can experience good growth again due to the positive divergence given in the daily time.
But if Bitcoin wants to try a correction again, I drew the next trend line for you.

LRC updatewell in my personal opinion i think btc is done with the major dump. we could go down more ofc. so DYOR
for the safest entry i would wait for breakout. or you can enter now but we could very well still go down the drain. so just make sure your following your risk management
the wedge target is actually the channel/bull flag*

"100 usd to 1,000,000 usd " challenge (5)We missed a massive pump on QUICK but life continues.
Next trade entered yesterday. Short on LRC
We go for 4:1 Risk reward with a leveraged short trade on this pair. See chart for stop loss.
Initial portfolio(usdt) : 96.7
Price entered in LRC(usdt): 2.3698
Filled(LRC) : 81 (Isolated borrow on Binance)
Total (usdt) : 191.95
Follow for more updates

LRC: DCA your entry
falling wedge
good fib retracement level to buy
SMI bullish DIV
but mostly some influencer is calling it
For all the reasons listed above this can break out, just DCA your entry and/or use stop losses because I think BTC will go to 40K and this can drag everything down, LRC included.
Good luck

LRC to $10LRC is consolidating for next big move. LRC is at support and best time to add it in your portfolio. This is new base.

$LRCUSDT Short to $2
$LRC confirming the bearish reversal from the first previous reaction that reached the low of $2.2
My target is slightly under $2, from their we will be monitoring and begin averaging our entries their. Main/Golden entry is $1.175 and below

LRC Still believe LRC is going to touch 1.50-1.60 area first (which would be bitcoin at 42k) before reaching that 7 or 8 mark.
But..
Im posting this after seeing the current volume from the last few months. That alone tells me to keep holding with big rumors like Nike, MSFT, Alibaba and the bank of China upcoming. Paired with confirmed yet unannounced like GameStop.

LRC -LAYERING ECO -- Only buy in recommended zone -- Signal ID# 207
COIN: LRC/USDT
Exchange: KUCOIN, BINANCE
Direction: Spot AND LONG
------------------
Position: 2%
Risk: med
Entries :
E1: 1.81
E2: 1.68
-------------------
Targets:
TP1: 2.25
TP2: 2.7
TP3: 3.3
TP4: 9, 18 , 50
-------------------
Stop loss: 1.57

Rlc/usdt is on breakout level,Accumulate some amount in this level for a Goog return in short time frame

April showers bring May flowersOn 4H TF, I figured out the impulse wave at 1.887. This is the truncation wave.
LRC has been occurring.
Let's wait and see

LRCUsdtTHIS ASK ME ANALYSE I DO IT FOR FRINDS:
this exchange and layer 2 project
great pump and we think can going up but have chanse more move up fundamental is good and this new year ETH good move and layer 2 can pump like FTM - MATIC and other this can going up more like that both pump but have chanse for more move and this layer 2 and is exchnage and nft platform
GL
EntryPoint:
1.9101
Supports:
1.7205
1.4851
1.2300
Resistance:
2.1177
2.1709
Targets:
2.4075
2.6187
3.0498
3.5519
4.4127
5.8095
for mid time and HODL:
8.2539
9.9201
12.8880
GL

LrcHello to all traders, the price is close to its long-term uptrend line. The price has also reached a very important support. I identified a shopping situation here. what is your opinion?
trendanalysis
Lrc

LRCLRC potential play depending on bitcoin and what not. if you miss the first potential entry wait for the retest of the purple line

lrc longas a layer 1 lrc is performing very good , currently it is in support zone trying to break strong resistance, lrc moon soon

Eyes on LRC TokenLRC formed a beautiful triangle pattern and looks set to break out soon. Long entry would be the daily close above the triangle for additional confirmation.

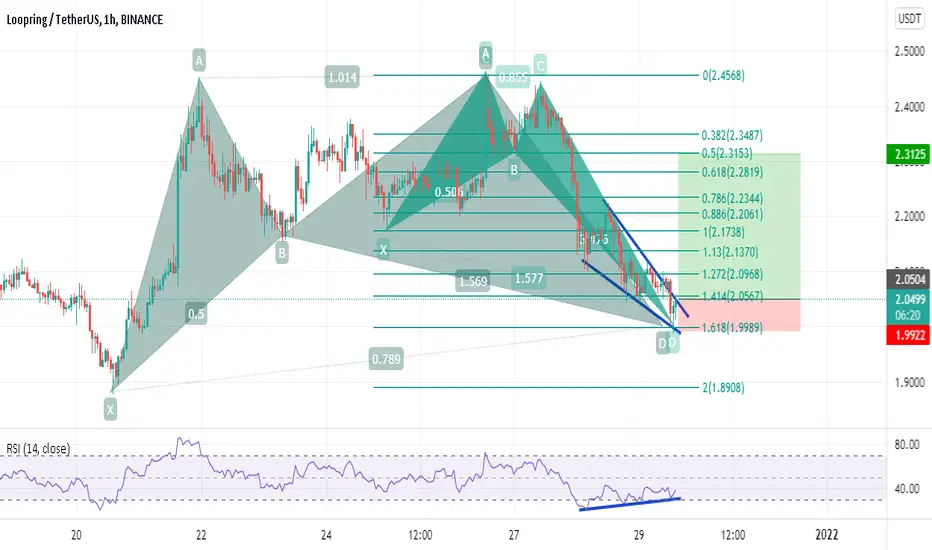
RR=4.5 buy ideabullish gartley + bullish crab + flling wedge + RSI divergence
PS : never risk more than 2% of your capital per trade
$LRC Support established at 2$ area
Support us by your like . when you benefit
take your risk management.

LRCUSDT DailyPlotting Fibs Retracement Exercise
2 Confluences area of Fib Retracement
50% & 61.80%
61.80% & 78.60%
PA trading inside a bullish pennant

LRC rejectedIf no announcement comes this week we can see a slow bleed for the next 4 weeks.
Down to base of flag, 1.60 areas where to the last dump wick reached. This will maych the weekly me and the gamestop quarterly report at the end of january ( or their possible timeframe for announcement ).
Wait and see plus, Accumulate.
Loopring opportunity!!!Loopring has broken its down trend line and after that we saw a symmetrical tringle.....now you can see we has passed from this tringle and now it's ready for buying.

LRCUSDT Wait for the confirm breakout of the Symmetrical triangle, 👉 or use the DCA.
Manage your own risk accordingly with that TP Stop-loss everything.

Loopring (LRC) A LOT OF POTENTIAL!Not a financial advice
Short term- 2.8-3.1
Mid term - 4-6
Long tern - 18-22-26-30-40-60
