LRC Loopring coin is a sleeping giant ready to awaken!!LRC I have been checking out for a while now. It is a platform designed to run apps and help with all things DEX. On Oct 29th.. LRC starting to come to life.. gaining 1000% over a few days!!! If LRC had ADAs market cap it would be worth $50!!! And i think it can get there easy. LRC is def one to watch for, and something I will be keeping track of. Cheers
LRCUSDT trade ideas

15min Technical Analysis on LRC Loopring These patterns occur on multiple time signatures
All patterns have the capability to fail
Nothing is guaranteed in the market but being to identify these patterns can help minimize risk and prevent unnecessary trading.

Update on LRCHello Everybody,
Quick update regarding LRC, after breaking above the falling wedge earlier today. LRC has witnessed a 20% gain. But I don't think it will stop here quite yet. We are currently trading between a bullish upward channel. I am targeting $4 this leg up.

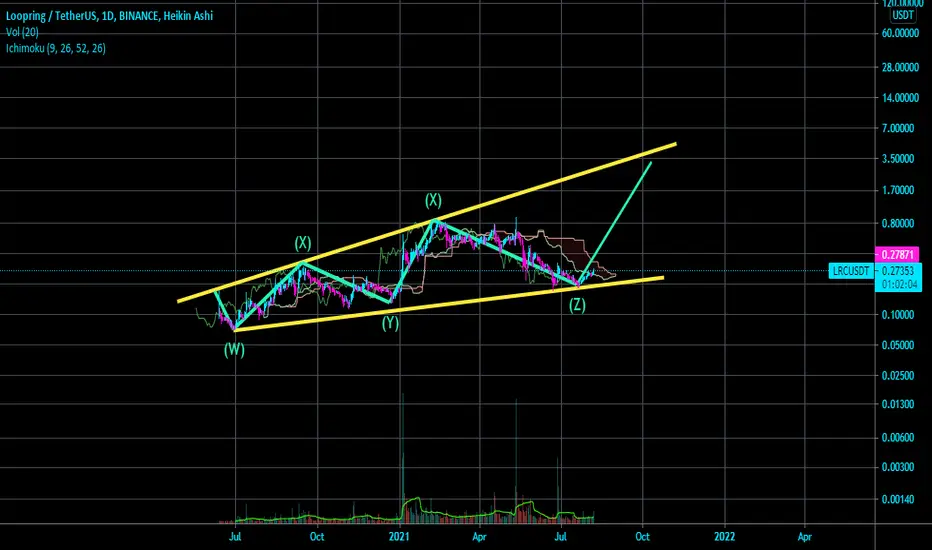
LRCUSDT - breakout - true or false?Despite the break of a trend line, this wave may be wave C of a flat pattern.
As such, it may be a wave (b) in a larger corrective pattern, implying we will get the next move down.
Good luck!

LRCUSDT BRAKING OUTBroke up from descending channel.
Not financial advise.
Good luck to all the traders out there and don't forget to take profits on the way up.

LRC UpdateHello everybody,
After doing some TA on LRC. I have identified a bullish falling wedge that can bring us all the way up to 4 dollars. Enjoy


long on loopwhatch this one >1$ real soon as more start to come to L2s. Mas crossing and ether on a bull run.
$LRC buying opportunity$LRC is not done yet nice buying opportunity at 2.4 and 2
Initial TP: 5
SL: 1.9

LRCUSDTIt has stopped making Higher Highs but lower higher is not broken yet. Trading in range between major support and resistances
Better to follow trade plan for safer entry and exit, enjoy

Trading Idea - #LoopringLONG after Fibonacci Retracement (50%) completed!
ENTRY: 1.2890 USD
TARGET: 2.2500 USD (+75%)
STOP: 1.0000 USD
Loopring's objective is to design and engineer optimized exchange and payment protocol on Ethereum, and to operate products that bring it to users across the world.

LRCUSD Refusing to go below 3$ -> but willing to go above 4$After a correction of mearly .382 from the first 5 waves, LRC is refusing to break the support of 3$.
Both the MACD histogram and Stochastics point to a rally upward.
Expect a short-term rally for 3.5/3.6$, and see what happens when it hit's the resistance.


LRC Update / Consolidation @ 3.26 and movement soonAs you can see in the chart a consolidation has formed around 3.26(white line) while still being in an up trend shown by the purple line that also acts as support. I'm certain that if it closes bellow the purple line we will start seeing some downtrend. To where? I don't know, but If that happens I believe the next consolidation will be around 2.83(red line).
Volume is also having a downtrend as people are waiting for something to happen. You can also see clearly the wave patterns oscillating around the 3.26 consolidation slowly fading to a flat line almost.
We should be seeing some movement soon. Not certain where it will go but overall I'm still bullish on it.


Be careful lrc may retouch 1.5 levelAfter up we may see some high sell of lrc was one of the best gems some days earlier but it's over anymore lrc is a great project and has great fundamentals but after reaching to new ath it must retest 1.5 area so be careful and manage your stop losses.
Happy trading.

LRC USDT Note: First of all, candle closings in the upper box invalidate everything I wrote below and show that this analysis is wrong. If this box is not entered or this box is not passed, my thoughts below are valid.
Analysis;
Fibonacci measurement at 4H may suggest that this is an elliot wave. But I don't think it's the elliot wave.
1st wavelength is too long
2. sellers consolidated too much
3 indicator values seem too high to me.
Fan intersections marked as circles on the graph should work as supports.
Check the rsi when the price comes to each circle area. If the rsi in 4H still has not fallen below 35 or if the rsi has not fallen below 60 in the daily time frame, it is possible that the decline will continue.
A good trade is the one in the last circle.
Note: This is not Investment advice.

LRC/USDT .... what if?...BINANCE:LRCUSDT
It looks like a symmetrical triangle, or a flag, for example.
The symmetrical triangle is generally considered a continuation pattern that signals a period of consolidation in a trend followed by a resumption of the previous trend.
This pattern is formed as a result of the convergence of two lines: downtrend resistance and upward support - both trend lines, when formed, should slope and converge at a point known as a top.

LRC Pump and DumpMy experience says that this looks like a pump and dump. I personally just sold another part of my LRC. Hope to buy it back between 0.5 USD and 1 USD. It is on All Time High related with ETH, much higher ATH vs BTC. I point out the sport to buy at 28 cents. We are now more than 10x profit (time to sell not to buy). I don't care if it goes much higher than this. There are other cheaper projects right now.

LRCUSDT 1H. Time To Sell ⏱️ Loopring, LRC has been on a massive up-move for days. It did over 300% .
But all good stuffs must come to an end.
It peaked out on the 4H chart at near $3.90 . Where I took my profit, because I saw the perfect indicator. After this I tweeted how it needs to cool off yesterday.
This is 1H chart, Double-Top formed already.
Failed to make Higher-High after previous bounce at 0.5 Fibonacci.
MA 10 is already broken twice on 1H.
RSI bearish divergence in progress
These are the signs, time to cool off for LRC . Time to take profit if you haven't already
Various support shown on the chart , support previously tested and the one yet to be tested.
Follow @CryptonKidd for daily analysis
PS : Tell me any Token you want me to do analysis on. I'd consider it.

LRC is forming CUP & Handle Go 4.5LRC chart is so clear , i think it is going to form cup & handle patern. The price could move to 4.5 i think or above.
Please make your own choice...
It is idea ... what do you think please comment below

wave 3hi
I think we are in wave 3 so maybe we will see the price test the channel again and continue to wave 5

Loopring forming cup and handle...Newbie here sharing my analysis. Correct me if Im wrong. This is my just my bias.
