Lrc next Target 0.45 and 0.580.37 resistance breakouts successfully, current target is 0.45. If 0.45 breaks then final target will be 0.58
Below the red trend line is risk. Price will not pump soon if it goes below the red trend line.
LRCUSDT trade ideas

Trend Continuation Idea 🤖 Multi-timeframe Technical Analysis:
D1 Bounced off strongly from key support level that holds the uptrend within the ranging market.
H4 Ichimoku Kumo Breakout destroying downtrend structure signaling the start of a potential reversal to the upside which goes along with Daily Timeframe trend and structure.
Key Areas
Key Support area: 0.2748 - 0.2493 (Potential Entries)
Key Resistance area: 0.4558 - 0.5243 (Potential Targets)
Please make sure to check brokers slippage along with trading fees for you to accommodate if the trading signal is useful for you or not.
Do not risk entire portfolio on a single trade. Remember market is king!
Stay healthy and happy trading!

LRC LONG SETUP (HOT PROFIT)Hi, dear traders. how are you ? Today we have a viewpoint to BUY/LONG the lrc symbol.
For risk management, please don't forget stop loss and capital management
When we reach the first target, save some profit and then change the stop to entry
Comment if you have any questions
Thank You

LRCUSDT time to buy has arrivedLRC is looking very strong compared to most coins. We belive that this is the time for investors to start looking at it. Our upside target is very conservative, but the price can jump so much higher...

LRC rocket....as the candle passed sell signal youo can see how LRC shoot up. so you guys enjoying our free verison.
get it here
first expected target 0.47 and then moon

#LRC | LONG | TRADE#LRC | LONG | TRADE
Entry Conditions:
| Breaking out of Ascending Triangle Formation
| Bounced off 20, 50 & 200 DEMA
| Breaking out of RSI Trendline and resistance

LRCUSDT is testing the supportLRCUSDT has experienced a clear bearish impulse in the past, and is currently in a consolidation phase. The price is now testing a key support level at the $0.35 area, which is an important level to watch for traders.
According to Plancton's Rules, if the price of LRCUSDT breaks below the key support level and starts to trade below it, it could be a signal for new short positions to be initiated.
–––––
Follow the Shrimp 🦐
Keep in mind.
🟣 Purple structure -> Monthly structure.
🔴 Red structure -> Weekly structure.
🔵 Blue structure -> Daily structure.
🟡 Yellow structure -> 4h structure.
⚫️ Black structure -> <= 1h structure.
Follow the Shrimp 🦐


LRC Long ideaIf we don't break below XA we should see the Alternative Bat playing out and reaching the full retracement to 0.3839 at the very least. T2 would be more risk-worthy and I will not play it.
Stay safe harmonic traders :)

LRCUSDT: LONG SETUPLRC is currently moving in a bullish channel,
It tested its down trend line.
I am expecting a huge bullish move toward my target which is a measure move of second leg
Its BTC pair is also at strongest support level.
There might be some up and down,
But lets see


Lrc Breaking bullish pennant Formed Bullish Pennant In h4 timeframe Incase Of breakout expecting 30 to 35% bullish Move
Look For buying Opportunities After breakout

LRC/USDT RISING WEDGEThe price chart in 1H TF showing a rising wedge and bearish divergence, looks like it is very close to enter our plan.

LRCUSDT SHORTI took a short position from 0.3627
my first target point is around 0.3450..
NOT A FINANCIAL ADVISE.

LRC 15 MinLRC 15 Min
Cup & Handle chart pattern
#LRC /USDT
Signal Type: Long
Leverage: Cross 20x
Entry Targets: 0.3596
Take-Profit Target:
1) 0.3687 ( 50%)
2) 0.3775 (100%)
3) 0.3830 (130%)🚀
Stop-Loss: 0.03506 (-50%)

LRCUSDT IdeaPOLONIEX:LRCUSD BINANCE:LRCUSDT
✅ ✅ Risk warning, disclaimer: the above is a personal market judgment and analysis based on published information and historical chart data on The trading view,
And only some of these analyzes are my actual real trades.
I hope Traders consider I am Not responsible for your trades and investment decision.

LRCUSDTHmm.. It sounds like a racing horse, is it tho?
Time will tell, clearly there is huge demand going on.
Lets see where we will end up, things looks very positive imo.
This is not a financial advice. Only for educational purposes.

The rise of wave four or wave CThe currency has completed a three-wave decline, A, B, and C, or a five-wave decline, and a fourth and fifth wave remains, and this is what we will know with more data that will appear later.


LRC: Pullback in UptrendLoopring (LRC) technical analysis:
Trade setup: Following a bullish breakout from Falling Wedge pattern, price reached our target $0.50 where it got rejected. Pullback near $0.30 support and 200-day moving average could be a swing entry. Momentum is inflecting bullish again (MACD Histogram rising).
Trend: Downtrend on Short-Term basis, Neutral on Medium-Term basis and Uptrend on Long-Term basis.
Momentum is Bearish but inflecting. MACD Line is below MACD Signal Line and RSI is below 45 but momentum may have bottomed since MACD Histogram bars are rising, which suggests that momentum could be nearing another upswing.
Support and Resistance: Nearest Support Zone is $0.30, then $0.20. The nearest Resistance Zone is $0.40, then $0.50.

LRC BULLS TO TAKE OVER Hello Traders and everyone, I am Hadi Karaali, Known as SNIPERS_FX
If you like the idea, do not forget to support with a like and follow.
QUICK UPDATE ON LRC
As we can see price is still overall bearish making clean lower lows and lower highs
However, price now is around a strong support zone where we will be looking for new bullish reversal.
So, for the bulls to kick in from a short-term perspective we need a break above the marked major swing high.
Until that happens, we are still bearish, and price can still dive more before reversal
If you like this kind of analysis don't forget to like and follow
and as usual follow your trading plan and manage your risk.
Be patient and good luck!

LRC targetsthe first resistance is 30% up it really isnt heavy could be an easy breakthrough 60% is the next one may levels thagt is a major area...
We have seen lrc go on crazy runs before "fall/winter"2021

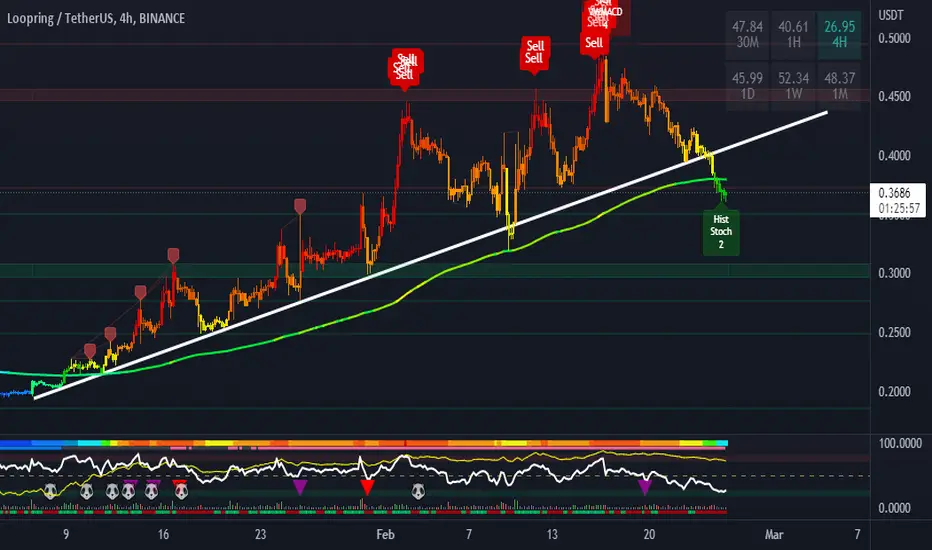
LRCIdea: The price has broken through the uptrend line and the 200 EMA of the 4 hour time frame - the key support levels. The nearest support levels are $0.35 and $0.3. The price may retest 200 EMA, then the fall will continue