$47 for Mr. 47th himself? TA aside, fundamentally its a no brainer. No matter how much you hate him, there is no reason a stock that has half of its market cap ($2 Billion) in CRYPTOCAP:BTC should stay at the market cap of $5 Billion.
Next time there is a pump rally in Bitcoin, this thing will join in on the fun.
$47 is not unrealistic. That would set the stock at around a $10-$15 Billion Market Cap value.
A3CYXD trade ideas
$DJT You May Not Like It But It Will Go Up🟢 Why someone might buy DJT stock
Massive buyback plan – Recently approved a $400M buyback (≈10% of shares) using non-crypto funds, signaling confidence in its value
Aggressive Bitcoin playbook – Raised ~$1 B in convertible bonds to fund a $2.5–3 B Bitcoin reserve, tapping into the crypto surge .
Election-fueled volatility – Historically sees surges tied to political events (e.g., 18% spike pre-election)
Tight float, big upside potential – Low institutional ownership, huge insider/trust holdings = a thin float that could exaggerate price moves
Technical momentum in play – Short-term MACD and pivot bottom “buy” signal recently triggered
🏦 Bond offering — Low-risk lender perks
DJT issued zero-coupon convertible senior secured notes due May 29, 2028:
$1B principal @ 4% discount (≈$960M net proceeds)
Secured by Bitcoin + cash collateral, with strict collateral ratios (loan must remain ≤ value) .
Conversion feature at $34.72/share (≈135% premium to current price!)—if price hits that, investors can convert to equity
Optional early repurchase right in Nov 2026 (~18 months in)
✨ Why it’s a fun but risky play
High-reward setup: A small bet now, big upside if crypto rally unfolds or DJT stock surges due to political or earnings catalysts.
Upside triggers: Successful Bitcoin accumulation, buyback impact, user growth of Truth Social/Truth+.
Risks remain: Bleak fundamentals—massive losses, minimal ad revenue, and little institutional backing
🎯 In summary
DJT is not for the faint of heart—it blends political buzz, crypto ambition, and strategic capital moves. If you believe in Bitcoin’s next wave, see value in the stock being repurchased, and buy the narrative—and you're okay braving volatility—this play could pay off big.
I had Ai organize some thoughts lol. I will see you at 30 :)
Be ready to rideUpside Potential:
Expansion plans for TMTG+ streaming and crypto partnership, though still early stage
Considerable Risks:
Extremely low revenue with heavy losses; profitability is far off
Share dilution potential: a Trump family trust controlling ~52% could dump ~$2 billion shares via SEC registration
Regulatory and competition uncertainty in social media, crypto, and streaming sectors
Sentiment-driven trading and potentially loud meme-stock swings
✅ Summary Takeaway
DJT is best characterized as a high-risk, speculative play tied closely to political momentum rather than traditional financial fundamentals. While it has deep losses, minimal revenue, and a lofty valuation, it generates volatility based on headlines. Its solvency profile is solid, thanks largely to cash reserves, but intrinsic value models suggest it is significantly overvalued.
DJT Is Down 68% From Its Peak. Is It Close to Turning a Corner?President Trump’s Trump Media and Technology Group NASDAQ:DJT announced this week that its board has authorized up to $400 million of share repurchases at a time when the stock is down some 68% from last fall’s peak. What does technical and fundamental analysis say could happen to the social-media firm’s stock next?
Let’s take a look:
DJT’s Fundamental Analysis
Trump Media and Technology Group is the operator of the "Truth Social" social media platform, the "Truth+" streaming platform and the "Truth.Fi" fintech brand.
The company plans to make stock and/or warrant buybacks through open-market transactions, with all repurchased shares retired.
It will pay for the buyback program out of the firm's balance sheet, which had $759 million in cash vs. just $27.2 million of liabilities as of March. (DJT’s cash position is separate from its recently announced $2.3 billion investment in Bitcoin COINBASE:BTCUSD .)
In addition to share buybacks, management authorized the company to repurchase convertible notes from time to time through privately negotiated transactions. DJT had entered in May into a subscription agreement to offer 0% convertible senior notes due in 2028 as part of a roughly $2.5 billion fundraising effort that included other convertible notes and an equity issuance.
As for earnings, Trump Media will likely report Q2 results in early August, although the firm hasn’t yet announced a firm date for doing so.
Last month, DJT reported a $0.14 Q1 adjusted loss per share on $821,200 of revenue. However, Trump Media only went public in March 2024, so we don't have much in the way of historical earnings data to compare that to.
DJT’s Technical Analysis
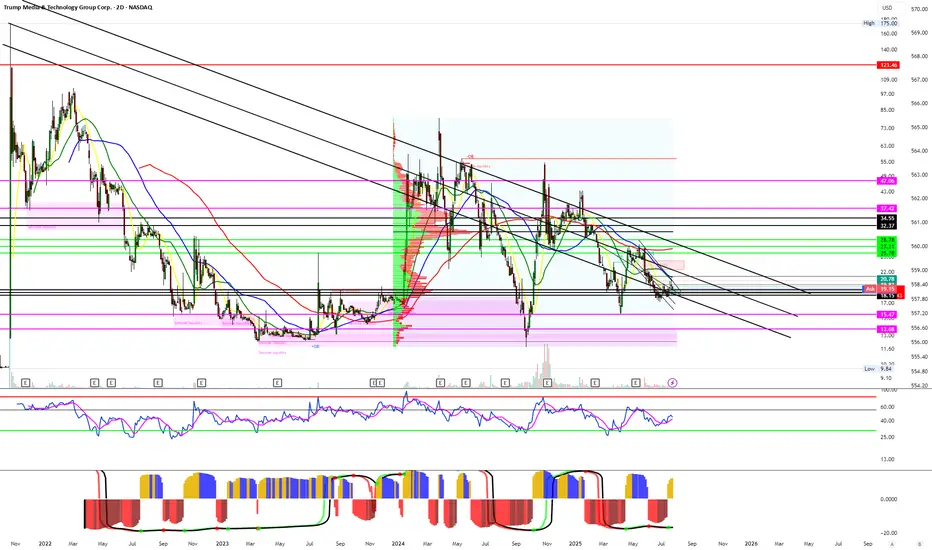
With few fundamentals to look at, we’re mostly left with technical analysis to assess this stock. Here’s DJT’s chart going back to last fall:
Readers will see that the stock has been mired in a so-called “falling-wedge” pattern of bullish reversal since very late last October.
DJT made serious attempts to break out of the pattern to the upside in January and again in May, but has yet to do so.
That said, the stock found support at the pattern’s lower trendline in January, early April and May. Typically, it tends to take a stock two to three touches at these patterns’ tops and bottoms before shares see a breakout.
Meanwhile, DJT has also been unable to retake its 200-day Simple Moving Average (or “SMA,” marked with a red line). Nor has it managed to retake its 50-day SMA (the blue line) or its 21-day Exponential Moving Average (or “EMA,” marked with a green line).
Still, the stock has remained within striking distance of all three key moving averages. As a reminder, the 50- and 200-day SMAs tend to impact decisions made by institutional portfolio managers, while swing traders rely more on the 21-day EMA and other EMAs of shorter duration.
As for DJT’s other technical indicators, the stock’s Relative Strength Index (the gray line at the chart’s top) has been weak for a month, but is currently flirting with entering technically oversold territory.
Separately, Trump Media’s daily Moving Average Convergence Divergence indicator (or “MACD,” marked with black and gold lines and blue bars at the chart’s bottom) is postured rather bearishly.
The histogram of the 9-day EMA (the blue bars) is below zero, as is the 12-day EMA (the black line) and 26-day EMA (the gold line). The 12-day line is also below the 26-day line.
That means there’s not a lot of optimism for this stock right now, but at least there’s also not much of a gap between DJT’s 12- and 26-day EMAs.
All in, DJT’s chart doesn’t look overly positive in technical terms, but a number of indicators say the stock could turn a corner. Add it all up and this might be a stock to keep on your "watch list" for now.
(Moomoo Technologies Inc. Markets Commentator Stephen “Sarge” Guilfoyle had no position in DJT at the time of writing this column.)
This article discusses technical analysis, other approaches, including fundamental analysis, may offer very different views. The examples provided are for illustrative purposes only and are not intended to be reflective of the results you can expect to achieve. Specific security charts used are for illustrative purposes only and are not a recommendation, offer to sell, or a solicitation of an offer to buy any security. Past investment performance does not indicate or guarantee future success. Returns will vary, and all investments carry risks, including loss of principal. This content is also not a research report and is not intended to serve as the basis for any investment decision. The information contained in this article does not purport to be a complete description of the securities, markets, or developments referred to in this material. Moomoo and its affiliates make no representation or warranty as to the article's adequacy, completeness, accuracy or timeliness for any particular purpose of the above content. Furthermore, there is no guarantee that any statements, estimates, price targets, opinions or forecasts provided herein will prove to be correct.
Moomoo is a financial information and trading app offered by Moomoo Technologies Inc. In the U.S., investment products and services on Moomoo are offered by Moomoo Financial Inc., Member FINRA/SIPC.
TradingView is an independent third party not affiliated with Moomoo Financial Inc., Moomoo Technologies Inc., or its affiliates. Moomoo Financial Inc. and its affiliates do not endorse, represent or warrant the completeness and accuracy of the data and information available on the TradingView platform and are not responsible for any services provided by the third-party platform.

Wedge Breakout: $DJT!🚨 🚨
📉 Downtrend broken with volume
📏 Falling wedge breakout confirmed near $17.90
🎯 Target: $18.71
🛡️ Stop Loss: $17.60
💥 Potential short-term reversal play in action!
Is NASDAQ:DJT about to bounce back from the ashes? 🔥
Watch this level... Smart money might already be moving 🧐
#DJT #WedgeBreakout #PriceAction #ReversalTrade #NASDAQStocks #ProfittoPath

Is DJT getting ready for a pump?The “Pump”—Trump Hype and Public Signals
-Trump’s social media signals: Trump frequently posts “THIS IS A GREAT TIME TO BUY!!! DJT” on Truth Social or X, coinciding with dramatic tariff announcements or political rallies. Shortly after, DJT stock often spikes—rising ~22% in a single day following one such call.
-High volatility & trading halts: The stock is extremely volatile; it sometimes triggers multiple trading halts within a single session due to rapid price surges fueled by meme-like interest.
-Retail-driven surge: The spike is largely driven by speculative retail traders—symbolic of meme-stock behavior and “scalper” pump tactics.
-It seems that the "pumps" are getting smaller and smaller, leading to a possible max pump of around 100-200% next time, if there's any pump. And as the current chart stands, the 16$ area seems like the start of the pump. But everything can change, and a new low could form and no pump could come.
The “Dump”—Insider and Early-Exit Selling
-Coinciding insider sales: Major shareholders—including Pam Bondi and other insiders—have sold significant chunks of DJT stock right after sharp price jumps.
-Sharp declines post-hype: Shares often retreat quickly after peaks. DJT’s recent crash washed out ~$2.4 billion in Trump's paper wealth, erasing gains from spikes tied to political victories.
-Regulatory red flags: Critics and regulators accuse Trump of influencing stock spikes before selling—bordering on “scalping,” a form of pump-and-dump via social presence.
-Disclaimer: This analysis is for informational and educational purposes only and does not constitute financial advice, investment recommendation, or an offer to buy or sell any securities. Stock prices, valuations, and performance metrics are subject to change and may be outdated. Always conduct your own due diligence and consult with a licensed financial advisor before making investment decisions. The information presented may contain inaccuracies and should not be solely relied upon for financial decisions. I am not personally liable for your own losses, this is not financial advise.

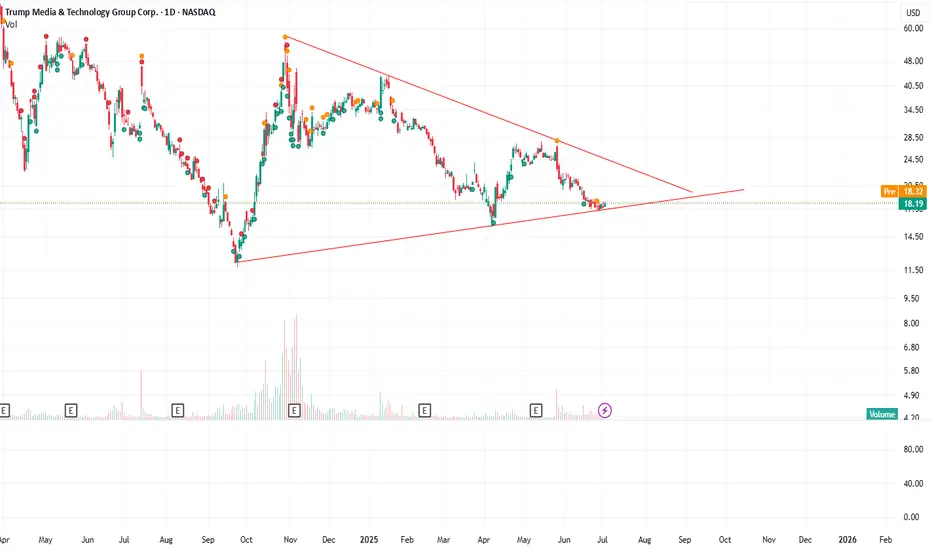
Upside breakout looks imminent The technical pattern is near to resolution any time now, maybe this week or next week. Then I expect an upside breakout.
After the bitcoin treasury news was announced the stock spiked and then sold off (typical when a company announces dilution). They reported the raise was complete late on Friday, then a few decent buys came in but most buyers haven't had chance to re-enter yet.
Any more bitcoin treasury news can be explosive for DJT.
Positive sentiment, meme effect, news, and the bullish technicals and I can see this popping big time!
Not investment advice. Just my own thoughts.

DJT // Our support point of 11.95 is suitable for buying. The upward movement accelerates in closings above the green line. You can accept the moving average we use as trailing average. In closings below 11.95, stop is the best decision.

DJT Falling Wedge Breakout? Reversal Loading!Chart Pattern: Falling Wedge (Bullish Reversal)
You’ve drawn a falling wedge, which is a bullish pattern.
Price is near the apex, indicating a potential breakout soon.
📍 Current Price: ~$21.14
📉 Support Zone: $20.80–20.44
🎯 Potential Targets (Take Profits):
TP1: $22.23 (gap fill + former support)
TP2: $23.40 (previous resistance)
TP3: $24.78–25.00 (major supply zone)
🛑 Stop Loss:
Below $20.80 (safe zone: ~$20.44 or even tighter depending on risk)
🎯 Risk-to-Reward:
Looks like 1:3+ R:R potential if it breaks out cleanly
🟡 Confirmation Needed:
Break and close above wedge resistance line
Volume spike on breakout
Ideally a green bullish engulfing or hammer candle

BTC bulls pause despite Trump Media entering the gameThe parent company of Truth Social, Trump Media & Technology Group (DJT), on Tuesday announced a $2.5 billion capital raise to build a Bitcoin treasury.
The announcement coincides with Bitcoin 2025, the largest Bitcoin-focused event of the year, currently underway in Las Vegas. Despite the bullish signal from Trump Media, shares of the company closed down approximately 10%.
Currently, Bitcoin is trading near $110,000, testing a resistance zone between $110,000 and $112,000. Price action near this level shows indecision. Immediate support is possibly observed around $103,000 to $105,000. While the long-term trend maybe remains bullish, the current price action could indicate a possible consolidation or pullback in the near term.

DJT - a lot of bullish patterns all overlooks like there are many different patterns here from the start of this spac
This stock has strong pumpomentalsJust bought couple shares of $DJT. Think its gonna moon, because a lot of traders do love President Trump. They said description is too short, but idk how come its short if I going to Long this stock. I think those who short sell NASDAQ:DJT will regret eventually. Cuz it's definitely gonna moon and rip all short sellers apart

GREAT TIME TO BUY DJTWent long when it was down 3% yesterday calls up 40%, massive crytpo.com news dropped today like every time before djt hit the lows, it's about to run massively. I'm not betting against trump.
Any pullback towards 20 would be great for entry.

DJT Weekly Options Trade Plan 2025-04-15NASDAQ:DJT DJT Weekly Analysis Summary (2025-04-15)
Below is a consolidated analysis based on the four reports:
─────────────────────────────
SUMMARY OF EACH MODEL’S KEY POINTS
• Grok/xAI Report:
– Notes that DJT is trading near its 10‐period EMAs on both the 5‑minute and daily charts.
– Indicates a moderately bullish short‐term outlook (helped by positive news about “Truth Social” investment accounts) even though the max pain is at $19.00.
– Recommends a call option trade (buy naked call) at or near the $20.00 strike with an acceptable premium (~$0.63).
• Claude/Anthropic Report:
– The report encountered an error and produced no usable analysis.
• Llama/Meta Report:
– Observes that while the 5‑minute chart shows short‐term bullishness (with price above key EMAs), the overall daily picture and max pain theory (targeting $19.00) point toward a slightly bearish bias.
– Suggests trading a put (such as buying the $19.50 put) but notes factors like high daily volatility and mixed indicators.
• Gemini/Google Report:
– Provides a nuanced view where the 5‑minute charts show consolidation near $20 while the daily chart’s indicators (RSI, MACD histogram, bullish postive news) favor a moderately bullish move.
– Highlights key liquidity around the $20 strikes and ultimately favors a call trade—leaning toward a slightly out‑of‑the‐money option ($20.50 call) but noting that trade risk should be managed tightly.
• DeepSeek Report:
– Summarizes the technical picture with DJT trading above short‐term moving averages but acknowledges max pain at $19.00.
– With a positive news catalyst and falling volatility (VIX), it leans moderately bullish and recommends a call purchase at the $20.00 strike.
─────────────────────────────
AREAS OF AGREEMENT AND DISAGREEMENT
• Agreement:
– All models note a current price of roughly $19.96 with technical support around the short‐term (near the 10‑period EMA).
– Ea
ch analysis recognizes key levels: immediate support near $19.85–$19.94 and resistance around $20.00–$20.50.
– Most models see positive momentum from favorable news (Truth Social catalyst) and improving short‑term indicators.
– Options-chain details (high OI and volume at the $20 strikes) underline the importance of that level.
• Disagreement:
– Llama/Meta tilts toward a bearish reading (using daily MACD and max pain theory, expecting a move toward $19.00) and suggests puts rather than calls.
– Strike selection differs slightly—with some reports favoring the ATM $20.00 call (Grok/xAI and DeepSeek) and others suggesting a slightly OTM $20.50 call (Gemini/Google).
─────────────────────────────
CONCLUSION AND RECOMMENDATION
Overall Market Direction Consensus:
The majority of analyses (three out of four usable models) lean moderately bullish on DJT in the near term. Positive technical momentum on the daily charts together with supportive news outweigh the bearish hints (like max pain and Llama/Meta’s view).
Recommended Trade:
– Trade Type: Buy single‑leg, naked call
– Chosen Strike: $20.00 call (weekly option)
– Expiration: 2025‑04‑17
– Entry: At open with an entry price near the ask of $0.63 per contract
– Risk/Reward Targets:
• Profit Target: Approximately a 20% premium gain (rising from $0.63 to about $0.76)
• Stop‑Loss: About 50% loss of the premium (around $0.32)
– Confidence Level: About 70% (reflecting the bullish bias driven by news and short‑term technicals, while remaining cautious of the max pain level)
Key Risks & Considerations:
– The max pain at $19.00 may exert downward pressure as expiration nears.
– Short‑term volatility remains high (VIX at 30.12), so the trade will need tight risk management.
– Should DJT fail to break above immediate resistance or show signs of a sharp reversal (e.g. dropping below $19.85), consider exiting early to protect capital.
─────────────────────────────
TRADE_DETAILS (JSON Format)
{
"instrument": "DJT",
"direction": "call",
"strike": 20.00,
"expiry": "2025-04-17",
"confidence": 0.70,
"profit_target": 0.76,
"stop_loss": 0.32,
"size": 1,
"entry_price": 0.63,
"entry_timing": "open"
}

DJT Rollercoaster TheoryHello friends.
DJT is Trump's stock. It has sold off recently due to falling interest from retail traders and the recent tariff shitshow. But Trump is still the president and is a very good attention whore like Elon Musk, which brings value to shareholders in his otherwise worthless company.
We are expecting that a low will come in at around $14.50, and then an echo bubble narrative will emerge as Republicans decide it's a good investment and become the next wave of exit liquidity. For this stock, a stop loss is important as it cannot be considered a long term investment. So I have stops around the lows.

DJTThe DJT stock made a strong upward move, breaking through the descending trendline shown in the chart around $28. It completed Wave 1 at $54.5 and then rose to a strong supply zone that we had previously warned about as the reason for the decline in the previous post, marking Wave A. It then dropped in a corrective move to the demand zone we had mentioned earlier and has now risen strongly in Wave B. Currently, we are in Wave C.We are now waiting for a strong buying zone, a cluster formed by the intersection of the descending trendline, the demand zone, and the completion of a harmonic buying pattern, which lies between $20.94 and $18.54(PRICE ACTION). The stop loss is set at a weekly close below $17. Our target is Wave 3, aiming for a breakout above the last peak at $54 Tthen 80$. This is the bullish scenario. The bearish scenario would be triggered by a weekly close below $17, but this possibility remains unlikely for now.

DJT - I’ll buy that for a dollarI’m still expecting to see a one dollar test in DJT. This is based on the current price range and the volume profile. The volume profile portends a break into new lows, and those theoretically can go to $1. The theory behind is is twofold. Firstly, we have a “half-node” VPVR. If you have an unfinished bell curve in the vpvr, you’re not leaving that node until major shelf’s are tested. The price is always drawn to the vpvr shelf. Secondly, the price history is net bearish with lower and lower highs - and we have a floor which has been tested multiple times. It’s ascending triangle is what I’m arguing, and descending triangle breakdown takes you to $1.
Bullish Opportunity – DJT (Trump Media & Technology Group)Bullish Opportunity – DJT (Trump Media & Technology Group)
🟢 Entry Zone: 22 - 22.65
❌ No Stop Loss (high-risk, momentum-based setup , but it is up to you)
✅ TP1: 28.00
✅ TP2: 35.00
✅ TP3: 40.00+
🔍 Technical Highlights:
• Price reclaimed the 9 EMA for the first time in weeks – early reversal signal
• MACD bullish cross with growing histogram – momentum building steadily
• RSI rising from oversold levels, suggesting increased buying interest
• After-hours price action shows strength above the EMA zone – buyers stepping in ahead of the open
• Structure resembles the early stages of a breakout move
📰 Fundamental Catalysts Supporting the Move:
• Strategic partnership with Crypto.com to launch blockchain-based ETFs
• DJT to integrate tokenized investment products via its Truth-Fi platform, tied to the Truth Social ecosystem
• This opens up a new narrative: social media meets crypto + ETFs – highly speculative, retail-driven space
• Volume and volatility are picking up following the announcement, driving renewed attention to the stock
📌 Summary:
DJT is setting up for a speculative momentum trade backed by strong technical signals and a fresh fundamental narrative.
No stop loss on this setup — suitable for short-term traders comfortable managing risk manually and long-term investors. If volume confirms, this could move fast.

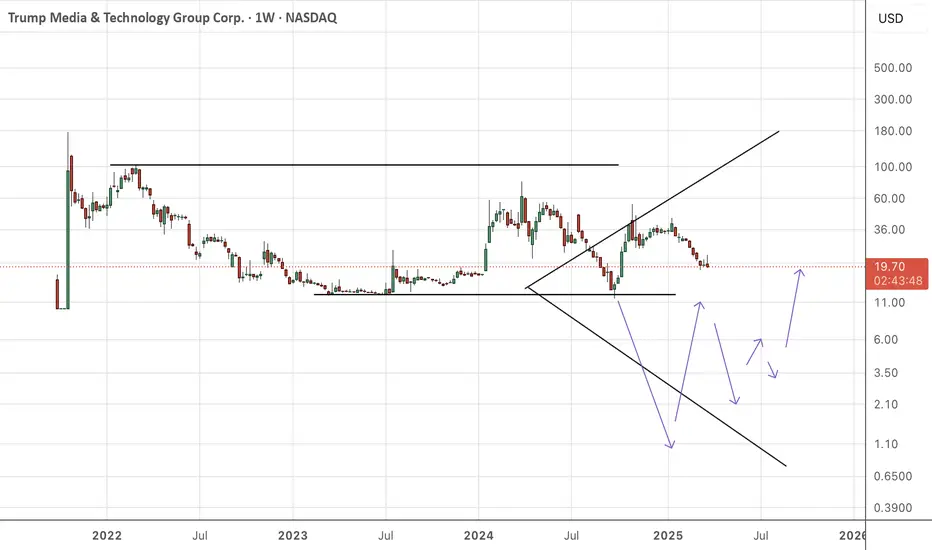
Future DJT move prediction by the end of may(wave3)using Elliott wave+ fibs to draw the prediction, if DJT can hold the low now, and see an uptrend coming, then this is what i can see in the near future. please do correct me and offer your ideas, thanks

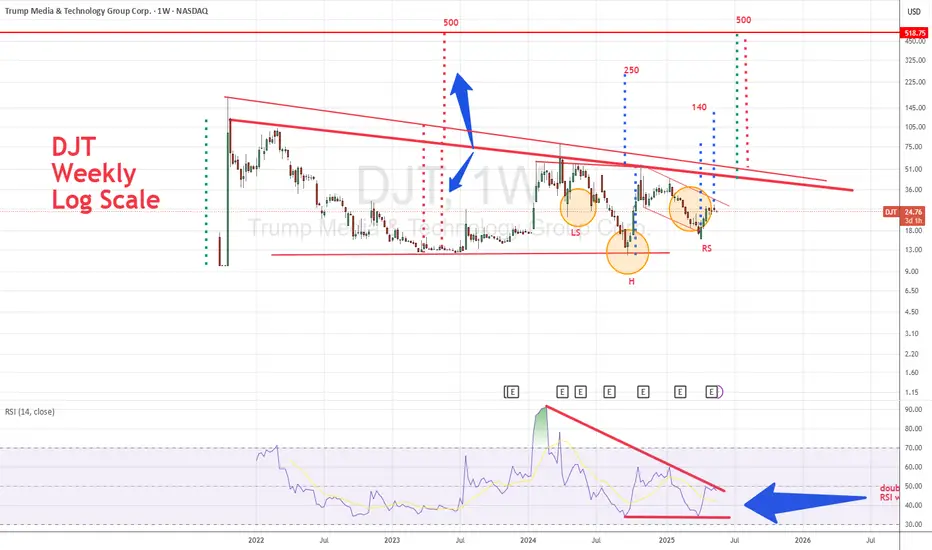
DJT DONALD TRUMP MEDIAThe trend is down. Still underwater but breakout is very close by. Would monitor if it reflects back down or travels up 80% upwards.

Trump Media ($DJT) – Truth Social’s Latest MovesTrump Media ( NASDAQ:DJT ) – Truth Social’s Latest Moves
(1/9)
Good afternoon, TradingView! 🌞 Trump Media ( NASDAQ:DJT ) is trending 📈, last at $ 29.23 per Feb 18, 2025, close (Yahoo Finance), down 3.82% that day. Q4 2024 showed a $ 401M loss, yet cash reserves hit $ 777M 🌿. Let’s dive into this social media play! 🔍
(2/9) – PRICE PERFORMANCE 📊
• Feb 18, 2025: $ 29.23, down 3.82% from $ 30.39 💰
• Q4 2024: Revenue at $ 1M, down from $ 1.1M year prior 📏
• Full Year 2024: $ 3.6M sales, $ 401M net loss 🌟
It’s volatile, with cash as a lifeline! ⚙️
(3/9) – MARKET POSITION 📈
• Market Cap: $ 6.43B as of Feb 18, 2025, per Yahoo 🏆
• User Base: 9M Truth Social sign-ups as of Feb 2024 ⏰
• Trend: Exploring M&A, per Feb 14 filing 🎯
Firm, betting on growth! 🚀
(4/9) – KEY DEVELOPMENTS 🔑
• Q4 Earnings: $ 401M loss reported Feb 14, 2025 🔄
• Expansion: Plans for Truth.Fi ETFs, per Feb 6 Reuters 🌍
• Market Reaction: Flat post-earnings, per CNBC 📋
Adapting, diversification’s key! 💡
(5/9) – RISKS IN FOCUS ⚡
• Losses: $ 401M hit in 2024, per Feb 14 filing 🔍
• Competition: Meta, X pressure social media 📉
• Regulation: Legal woes linger, per Feb 14 SEC ❄️
Tough, but risks loom large! 🛑
(6/9) – SWOT: STRENGTHS 💪
• Cash Reserves: $ 777M buffer, per Feb 14 filing 🥇
• Brand: Trump loyalty drives interest 📊
• Flexibility: M&A plans in motion 🔧
Got resilience in the tank! 🏦
(7/9) – SWOT: WEAKNESSES & OPPORTUNITIES ⚖️
• Weaknesses: Revenue down, losses up 📉
• Opportunities: Crypto ventures, M&A growth 📈
Can NASDAQ:DJT turn cash into wins? 🤔
(8/9) – NASDAQ:DJT ’s $ 23.93 , cash-rich but loss-heavy, your take? 🗳️
• Bullish: $ 35+ soon, M&A pays 🐂
• Neutral: Steady, risks balance ⚖️
• Bearish: $ -20 looms, losses weigh 🐻
Chime in below! 👇
(9/9) – FINAL TAKEAWAY 🎯
NASDAQ:DJT ’s $ 29.23 Feb 18 close masks $ 777M cash stash 📈, but $ 401M losses sting 🌿. Volatility bites, yet dips are our DCA gold 💰. We grab ‘em low, climb like pros! Gem or bust?

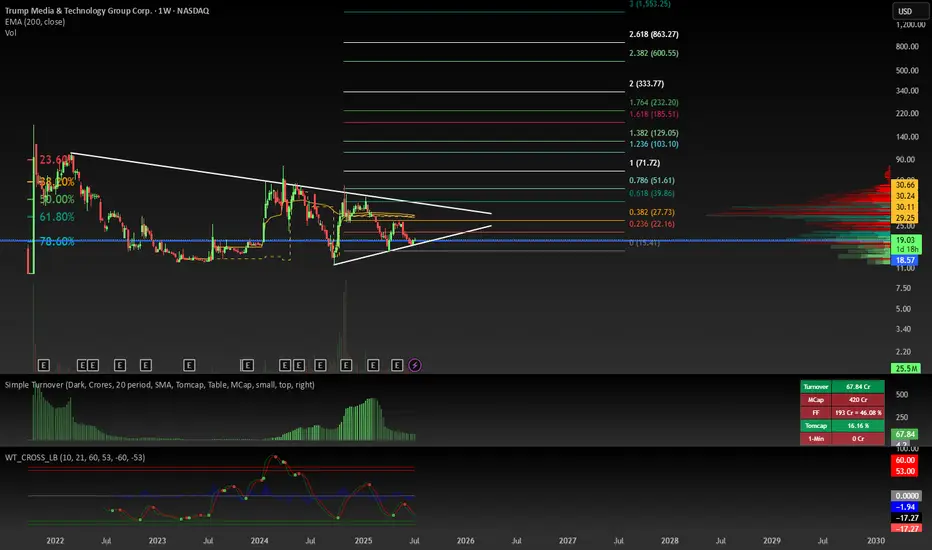
DJT - Parabolic Move IncomingNASDAQ:DJT is soon in my mind to begin the most insane of rallies. This chart for me is as clean as they come!
Recent Price Action
From the peak of October 2024 to recent days in February 2025 - the stock has seen a ~46% correction, in what is likely the completion of an Elliott Wave 2 correction (in X,Y,Z form).
This after a bullish initial Wave 1 formation saw it go beyond even the most bullish of bullish initial price targets, in just 2 weeks flat.
Price had prior to that been compressed inside a downwards-pointing wedge pattern (orange lines), since late March 2024. This is one of my most favourite bullish chart patterns. It often leads to explosive price action.
After breaking out of the wedge, it is now not-only putting the finishing touches to an Inverse Head & Shoulder pattern (grey text)... but when it does so it will also complete a massive Cup & Handle formation (white arrows).
Future Price Targets
The initial target (T1) from this move would be $570 (20x) in a very short period. Perhaps even by end of June 2025. This would coincide with the 1.414 fibonacci level. Drawn from its initial introduction to public markets to its peak just weeks later.
Thereafter, an extended 5th wave target of $1,020 (43x) could be reached sometime around late November 2025 and January 2026. This coincides with the 1.618 fibonacci level (darker blue T2 line).
Price as of today has overshot the 0.382 fibonacci line and back-tested the previously-formed left shoulder. It is likely to find support here on the yellow line.
Next Up...
Volume has been pitiful of late. Watch it ramp-up again in the next few days, just like we saw in September 2024 when it completed its full retrace.
It is my expectation that we will see rest of the markets surprising bears, with a huge reversal before March, perhaps even combined with a significant dollar devaluation.
During this time when volume picks-up, a sharp reversal to the upside out of its latest wedge (dark red lines) is possible before the week ends on 28th February. If this occurs, this will likely confirm the end to Wave 2 of 5.
If there is any further downside to come, the absolute worst case scenario will likely be ~$18 - coinciding with the 0.238 fib. However this is not expected, just something to be wary of.
NASDAQ:DJT from here is ready to begin the most volatile of Elliott Waves, Wave 3. If volume persists, price will be drawn like a magnet to the horizontal sloping trend line in bold white.
Possible Elliott Waves
Wave 1 - $12 to $55
Wave 2 - $55 to $24
Wave 3 - $30 to $570
Wave 4 - $570 to $175
Wave 5 - $175 to $1,020
Ridiculous targets, right? So what could be the catalyst?
With the appointment of Kash Patel, we may now start seeing legal action taken against entities & individuals involved with naked short positioning. NASDAQ:DJT even in it's short history has been a prime target for this since 2022.
NASDAQ:DJT may be partially or heavily-involved with the Sovereign Wealth Fund being discussed for the United States.
NASDAQ:DJT may also complete the long-rumored acquisition of Bakkt Holdings ( NYSE:BKKT ). Perhaps even obtaining a minority stake in TikTok.
Short squeeze, M&A, fraudulent recovery, purchases of ETHUSD or just plain old organic price discovery - you pick your poison. But if you thought you'd seen NASDAQ:DJT reach its peak prior to the elections, be prepared to rethink your views.
NASDAQ:DJT has a LOT of room to the upside still from here. Make sure at the very least, you keep this one on your watch-list.
----
Note : This post was originally published on 2nd November 2024 in the lead-up to the election. It was popular but was hidden due to an error on my part including a private indicator. It has now been updated to account for recent price action & timing.

Trump Media Analysis 💡 Reasons for a bullish movement based on technical view:
The price is currently testing a strong $20–$21 support zone, an area that has previously led to significant bounces, indicating strong buyer interest. A break above $23 could signal an early bullish reversal, while a move above $27 would provide further confirmation of an uptrend. Additionally, the RSI is near oversold levels, suggesting a potential bounce as selling pressure weakens. To strengthen the bullish case, it's crucial to watch for a surge in volume and price action around these key levels.
🔹 Target 1: $30 (previous resistance)
🔹 Target 2: $35 (stronger resistance level)
🔹 Drop below $20 could signal further downside
🔹 Bearish case: possible move toward $15
📈 Stay sharp & manage risk!
