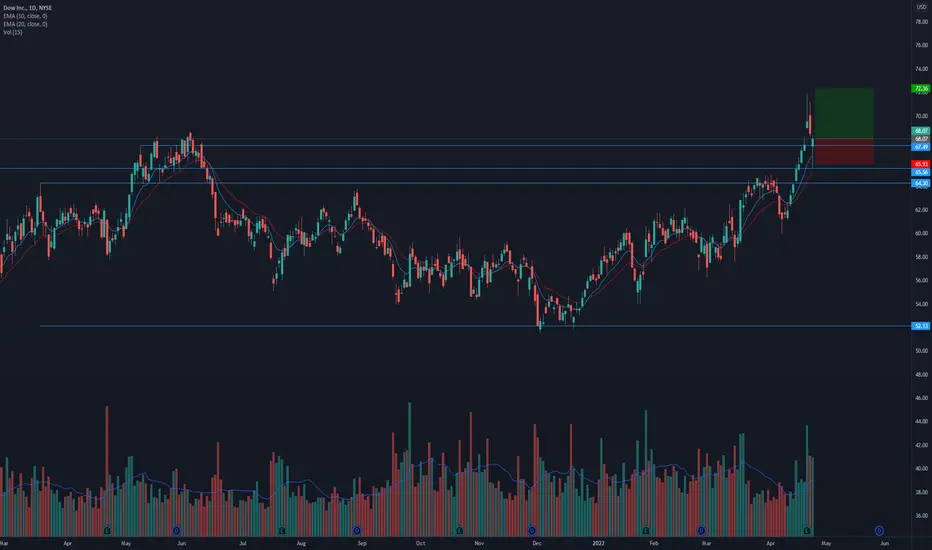
$DOW breaking out of a ~13 month base. Can it go higher?Notes/Thoughts:
* Great earnings record
* Strong up trend
* Breaking out of a ~13 month base with higher than average volume
* Recently used historical highs of $65.56 as support
* Last bullish hammer indicating tonnes of demand below $67.49
* Extremely close to the broken resistance of $67.49 offering a great risk/reward
Technicals:
* Sector: Basic Materials - Chemicals
* Relative Strength vs. Sector: 9.19
* Relative Strength vs. SP500: 8.08
* U/D Ratio: 1.2
* Base Depth: 29.46%
* Distance from breakout buy point: 0.86%
* Volume 46.06% above its 15 day average.
Trade Idea:
* You can enter now as the price is really close to the broken base resistance
* Manage risk accordingly
* If you're looking for a slightly better entry you may wait for the price to pull back to $67.49
* Due to the nature of this choppy market I've reduced my stop and targets accordingly.
0A1S trade ideas

DOW - Downtrend is done!! TRIGGER is required for any arrows on the chart. Please read below:
Having broken up the downtrend channel and a nice pullback, NYSE:DOW is now trading in an upward channel. However, $62 zone is counted as an important resistance on the road to higher targets. Looking close to the chart, we can see a great upward pin bar on the bottom of the upward channel, which shows that sellers did not have enough power to decrease the price more than this. For getting a trigger to buy, I personally look forward to seeing a break of $62, and a pullback to it (in H1 time frame). If the scenario happens, we can enter with the stop loss of $59 and the following targets:
$71 zone, till the mid of July, 2022
$82 zone, if the price reaches $71 zone, sooner than the mid of July, 2022.

Long $DOW - Inflation & Commodity PlayTrend analysis on $DOW potential future price action. This is considering supply chain issues on commodities , as well as inflation and Russian sanctions.

15/3/2022 NYSE (DOW)Buy (Entry Price) above the black line and exit (Stop Loss) below the red line. Can take profit at the suggested Target Price.
Entry Price: $60.48
Target Price: $61.96
Stop Loss: $59.00


DOWIf it crosses red line itll signal downward momentum.
Probably will bounce on the 50% or 61% fib levels as the 200 moving day average is located at the same place.
Recent golden cross. Bullish scenario if it bounces on red line and break out of gold trend

DOW long DuPont spinoff with 4.57% div yld and blended P/E of 7 versus normal of 18. With 28% forecasted drop in EPS into 2022, this would still give about a 118 target based on the normal P/E. This would be a 96ish target based on a P/E of about 15.
Slow growth, but it makes sense as an income play.
PT $67

DOW 01282022The DOW hit a Resistance Level that we have not seen since OCT 2021. A reversal is imminent. Supply Zones will be retested for an overall bearish disposition.

DOW Inc. Going Long For the first Quarter Dow Inc. set for a Bullish run for the first quarter . With the price now Retesting the Daily B.O.S @ the highlight level . It should push up from our entry to the Daily M.S ( Higher low) than Retest to ( Lower High) before another Bullish movement to the 65.00 level which is also a valid level . Going long for the first quarter on Dow Inc. , Us30 and the S&P 500 as all are showing a Bullish movement with the Technical Analysis

EMAs crossed likes march 2020, waterfall cominglast time those EMAs crossed was march 2020, the begining of the waterfall

Dow Inc Showing Classic Wyckoff DistributionAmazing example on Dow Inc. of a Trading Range following Wyckoff Distribution Schematic #2.
------------------------------------------------------------------
What is a Trading Range?
------------------------------------------------------------------
In an trading range there is a equilibrium of Sellers & Buyers causing price to move sideways but unknown to many the large operators are slowly absorbing all the Supply or Demand of the asset before starting a major campaign.
------------------------------------------------------------------
What is Wyckoff Method?
------------------------------------------------------------------
"One objective of the Wyckoff method is to improve market timing when establishing a position in anticipation of a coming move where a favorable reward/risk ratio exists.
In accumulation, the shares purchased outnumber those sold while, in distribution, the opposite is true. The extent of accumulation or distribution determines the cause that unfolds in the subsequent move out of the TR ."
Wyckoff Theory & Schematics give us clues to which probable direction the price may head out of the horizontal moving price structure.
In a Distribution Trading Range two of the key characteristics are the UTAD (Upwards Thrust & Distribution) above the Trading Range, and the SoW's Signs Of Weakness's with strong volume at the bottom end of the range.
------------------------------------------------------------------
Further Reading
------------------------------------------------------------------
For more information check out Stockcharts.com, Wyckoff Introduction & Tutorial for beginners.
school.stockcharts.com
For Distribution Schematic #2 for comparison:
school.stockcharts.com
------------------------------------------------------------------
If you found the idea informative & insightful then share the love with a like & comment, thank you!


DJI not in a good shape currentlyThis is just my analysis and should be considered only for Study purpose and not as a recommendation as i am not responsible for your losses or get a share from your profits...
This is a simple price action study... looking at the chart i feel the Dow is ripe for a bit of a correction...
I feel we could stay away for a while and let the market play its card and do what it has to do...
Be fearful when everyone's greedy - you'll know what i mean....

Dow ready to fall into 2020 territory again Once below pre-covid levels there will be no Fed magic to recover the fake market


time to go for shortit is already retested and needs to go down till 52.5
it is not financial advice

Dow Jones Update We have been following the Dow for over a month now since the transport divergence. The breakdown of the dow continues. Expecting a bounce tomorrow before more blood.


