$DDOG new ATHS?I've applied wave theory to their chart. I like the price structure. Been squeezing into the emas, and the stochastic has held below 30 when it occurs. one of my favorite internet companies. $DDOG has earnings on 2/11 that should contain pretty exciting things. keep them on watch. Price targets on the chart. Not financial advice.
0A3O trade ideas

Decision time for DDOG to seek for a trend Looks bullish, but we'll have to see. Obvious enough for us to see. Set your ALARM.

DDOG LONGDDOG Long on confirmation of breakout. A little early for a trade idea but sometimes early is good entry! use the lower trendline as your exit. PT $120

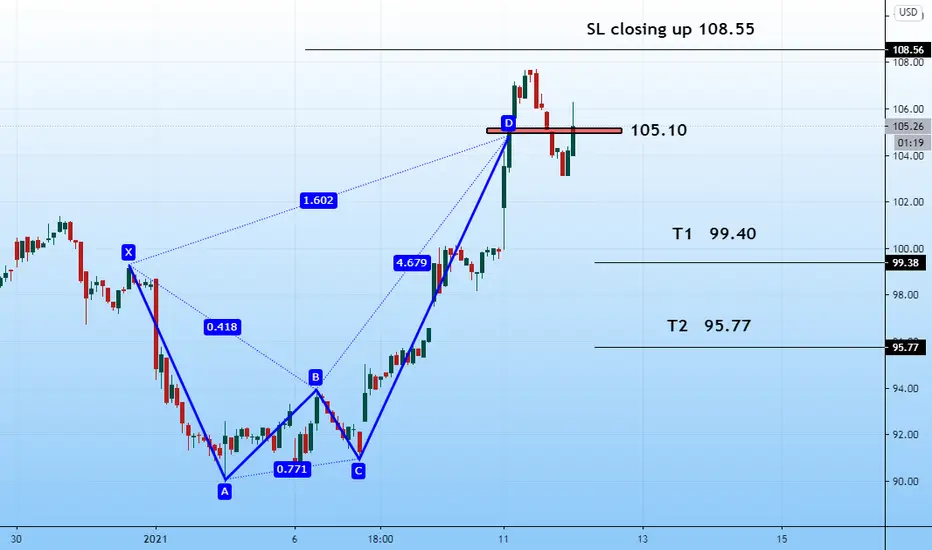
DDOG#DDOG, DataDog Inc, has been waiting for the entry point to this cool paper since October. Here the pattern is called Supported Triangle, and it is recognized as super reliable, and it has several growth goals, only the first is indicated on the screen. Under such conditions, you can confidently enter the medium term from 2 years

$DDOG PUSHING UPThings I like, price closed above 10 ema, macd pushing up and volume is good. Should have a good week
$DDOG - Consolidation for breaking above or additional support?Main support in range is 96.5$
Trend resistance line above is the main obstacle for Long entry.
Alarm set to break the line above - potential target 118-120.
Not recommended to buy or sell DDOG stocks.
Just an idea,

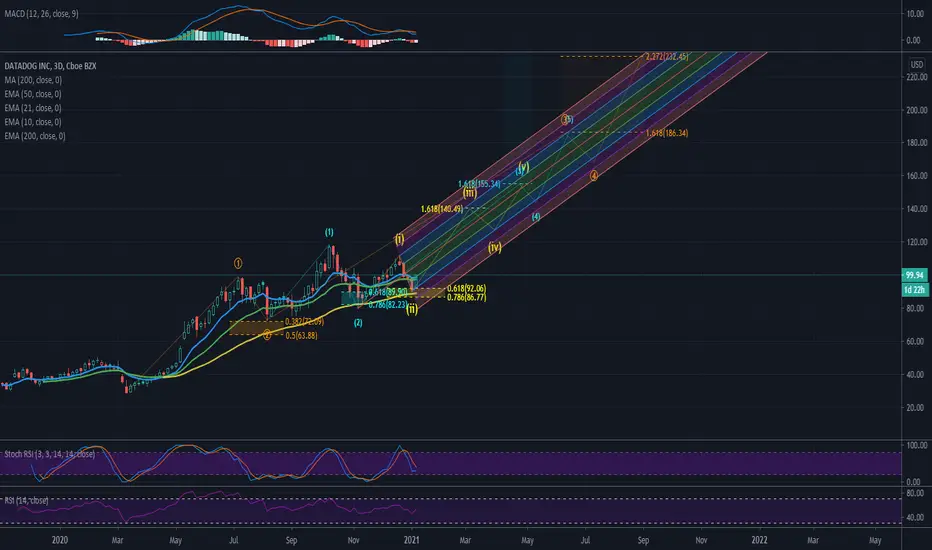
DDOG wave 3 on primary and secondarygreat levels to buy at
----bottoming out on channel
----wave 2 retracement finished on primary (blue) as well as secondary (pink)
good luck everyone
not financial advice

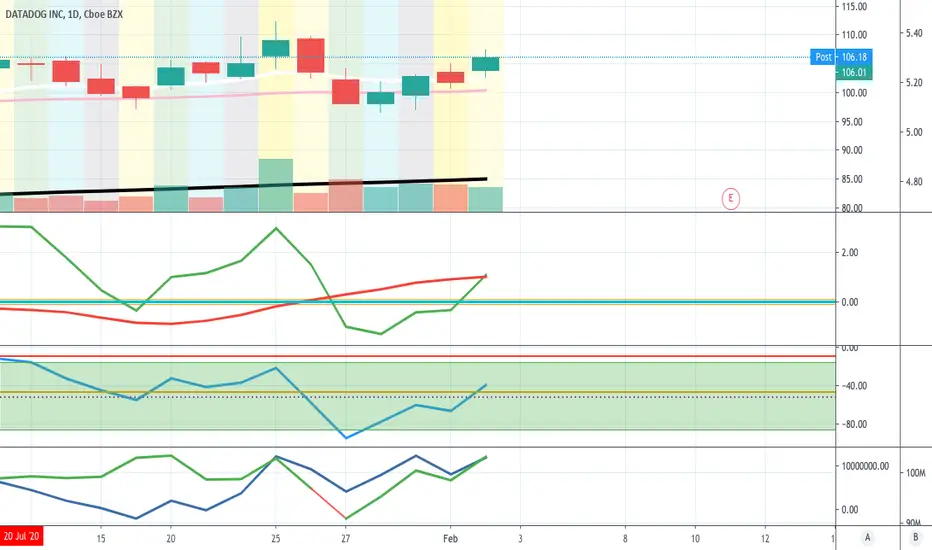
#DDOG Triangle Long!- DDOG looks like a Bullish Triangle With E ending bouncing off the cloud as well as the trendline.
- Also with thouse bullish engulfing candles the low has been set stop loss would be bellow or at that candle.
- DDOG also is a highly bought up by the legendary Cathie Woods.

Datadog appears to be ending the consolidation phase Hi. Datadog presents good risk/reward ratio entries above 111 or below 97.5 levels.
Fundamentals: Datadog is a data analysis company with strong business fundamentals. The revenue growth should accelerate as businesses recover.
Technical analysis: Stop loss can be put at 89. In the most bullish scenario we could be the 5th wave which could get us to 152 level.


DDOG uptrendBeautiful chart. ready to retest two resistance levels, including at, and then test 120 psychological level. Happy trading!
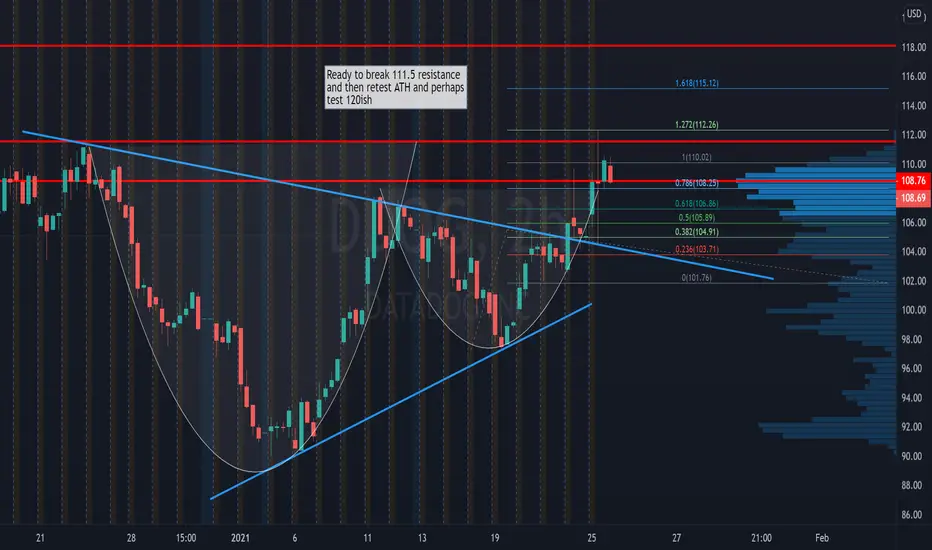
DDOG BUY OR LONG , TARGET $145DDOG Confirm a "Cup And Handle " with buy point around $108-109 area.
DDOG buy : $108
DDOG target : $145 = pattern height.
DDOG stop loss : ($101 or min $105) .
Wish you good deals!

DDOG Consolidating in RangeI'd love to see DDOG break out of this trend and up to the previous highs, support at 102, resist above 109.

DDOG to 120?DDOG - Currently in a a flat correction and looking for a breakout of the triangle to retest ath. With earnings approaching (mid February) we could see a nice run up to retest ATH. This company has shown strong growth and has generated great returns since its IPO in 2019, nearly quadrupling it's IPO price in 2020. DDOG reported a 61% increase in revenue for Q3 and an outlook of a 62% increase in the year of 2020. Trading Plan annotated in the chart.
Options Ideas
--------------------
110 C 1/29 (High risk: High reward) day trade option
120C C 2/12 (Medium Risk: High Reward) High OI

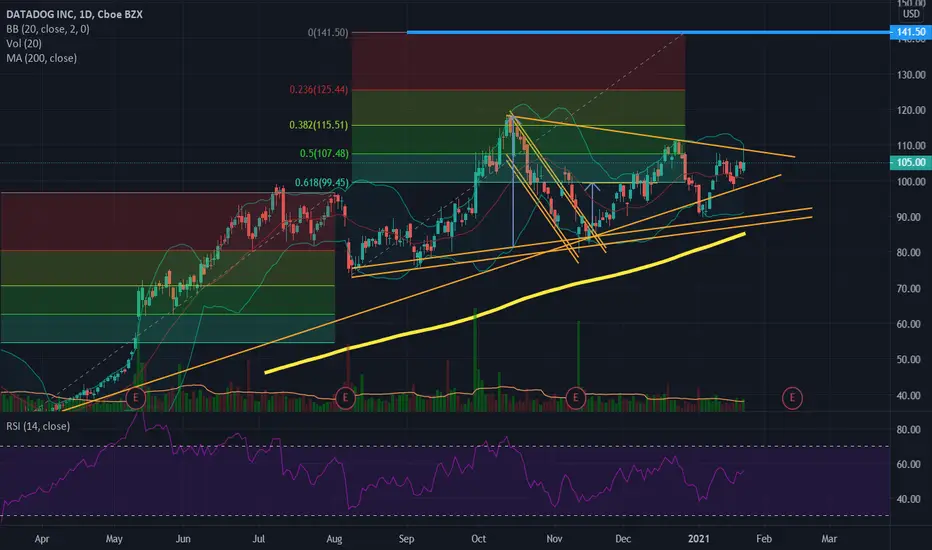
Datadog: active goal in the 141$ level
Another bullish stock. Right now has an active goal in the 141$ level by Fibonacci. Also the stock is making a triangle that can be broken upwards defining the same goal as Fibonacci. Stock bullish anyway.
DDOG | The Dog likes Ascending TrianglesIf I have learnt anything about DDOG over the past year or so, it's that it likes Ascending Triangle set-ups and big breakouts.
I know past performance is not an indicator of future prices but consider the following:
- DDOG has reacted consistently positively to past ERs - upcoming ER should be no different, and can help us break out of the current Ascending Triangle
- RSI is improving after weakness in November 2020
- We can see an "accumulation" range of volume over the past month or so
I don't really have a specific trade set-up here since this has been a Buy and Hold position for me over the past year or so.
I won't be looking to exit the position anytime soon, even if the ~$138 PT* is hit. For the pure traders out there, DDOG has usually found resistance at 1.68 Fib extensions.
*(PT is a function of 1.68 Fib extension, which is surprisingly similar to the magnitude of the previous pop in early October)
Any thoughts?
Thanks and Good Luck!
(*This is not financial advice, for sake of discussion and illustrative purposes only*)

Symmetrical TriangleCan break up or down..
The symmetrical triangle, which can also be referred to as a coil, usually forms during a trend as a continuation pattern. The pattern contains at least two lower highs and two higher lows. When these points are connected, the lines converge as they are extended and the symmetrical triangle takes shape. Price move between 2 converging trendlines that slop in opposite directions. Volume often recedes during triangle formartion.
In order to qualify as a continuation pattern, an established trend (at least a few months old) should exist. The symmetrical triangle can extend for a few weeks or many months. If the pattern is less than 3 weeks, it is usually considered a pennant. Typically, the time duration is about 3 months.
The future direction of the breakout can only be determined after the break has occurred. Sounds obvious enough, but attempting to guess the direction of the breakout can be dangerous. Even though a continuation pattern is supposed to breakout in the direction of the long-term trend, this is not always the case.
After the breakout (up or down), the apex can turn into future support or resistance. The price sometimes returns to the apex or a support/resistance level around the breakout before resuming in the direction of the breakout.
Patterns with heavy breakout volume often perform best..
Just an observation

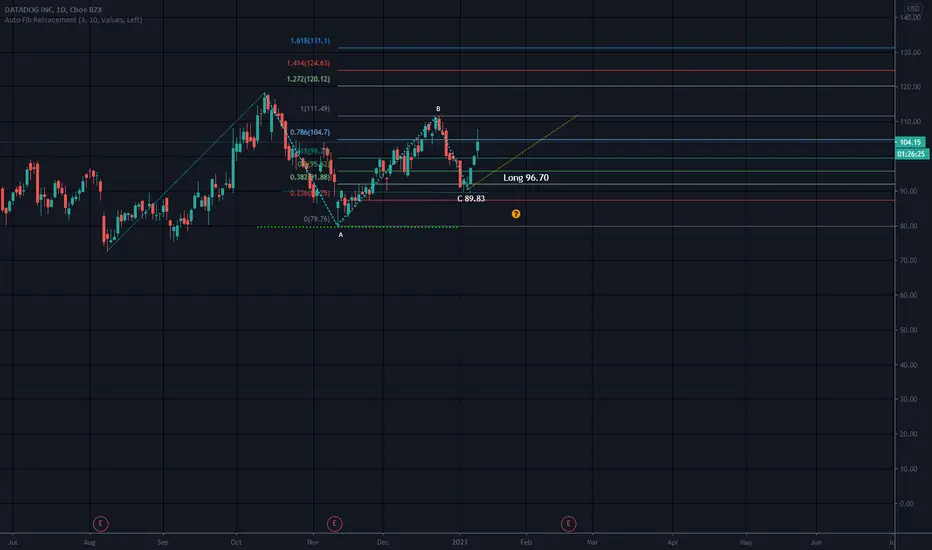
ABC BullishPossible stop under C.
A= 79.76
B=111.49
AB Leg=34.73
Targets calculated using AB leg length.
Long entry when price breaks the BC leg with an uptrend..
C can not go below A..
Not a recommendation

DDOG Symmetrical TriangleNice symmetrical triangle on the weekly chart. If we break up out of the triangle, my targets are $108.69, $118.64, $131.28, and finally, $147.36.
If the pattern breaks down, I'd short below $90 down to the low $70's.

$DDOG Long term analysis: 200+ by EoY 2021DDOG looks to be in a 1-2-1-2-1-2 setup, getting ready to launch.
Targets are $140, $155 and $185 by mid to late summer (june to july)