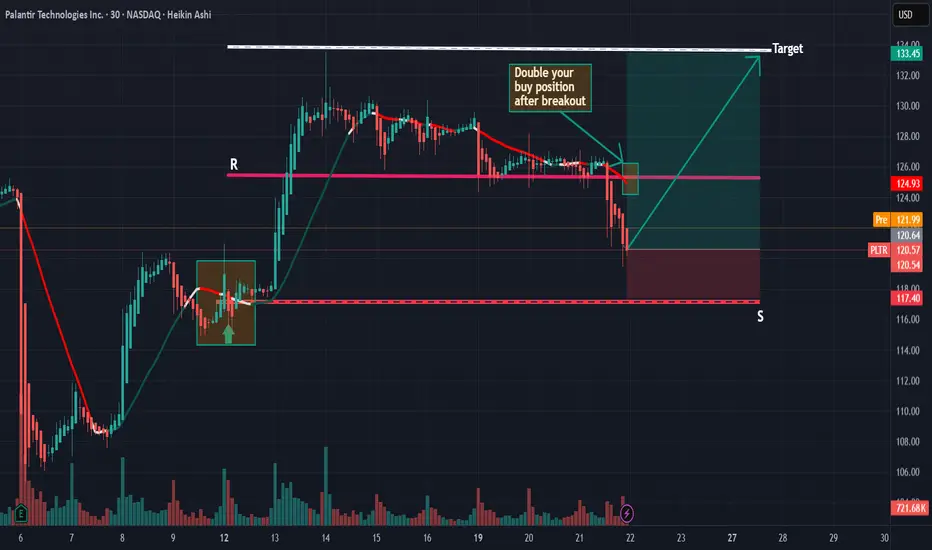
PLTR – Flag Breakout Above All-Time HighsPalantir is printing a bullish flag pattern right above its all-time highs — this is a textbook continuation setup that often leads to explosive upside.
🔹 After a strong breakout to ATHs, NASDAQ:PLTR has been consolidating in a tight range — a healthy pause.
🔹 Flags that form above prior resistance often act as launchpads when volume comes in.
🔹 Break over the flag highs could open the door to a new leg higher.
Setup Notes:
Watching for a breakout over the flag with volume confirmation.
Tight stop under the flag base keeps risk defined.
Price action remains bullish as long as it holds above previous ATHs.
🧠 This is one of my favorite setups — strong stock, strong base, strong trend.
this is the first pull after this initial thrust. The pullback has been boring and orderly too which i think is bullish for the stock
0A7R trade ideas

Palantir Technologies (PLTR) Shares Pull Back from Another HighPalantir Technologies (PLTR) Shares Pull Back from Another High
Shares in Palantir Technologies (PLTR), a company specialising in big data analytics software, have seen phenomenal growth in 2024, surging by approximately 340%, making it the top performer in the S&P 500 (US SPX 500 mini on FXOpen). This exceptional performance was driven by booming demand for artificial intelligence (AI) and machine learning technologies, which underpin Palantir’s products. The company has demonstrated steady growth in revenue and profitability, attracting major new clients across both the commercial and government sectors.
In 2025, PLTR remains among the market leaders, with its share price up roughly 60% year-to-date. In mid-May, it hit a fresh record high on the back of a strong fundamental backdrop. That backdrop was bolstered yesterday by news that the Pentagon had increased funding for its Maven Smart System programme — which involves deploying AI on the battlefield — to $1.3 billion through to 2029.
However, this news did not result in a new high. In fact, this week, PLTR stock have underperformed the broader stock market — and this may be explained by technical analysis.
Technical Analysis of the PLTR Chart
The interplay of supply and demand in 2025 has formed a broad ascending channel, characterised by:
→ The price breaking above the upper boundary in February following a strong earnings report, and dipping below the lower boundary in response to Donald Trump’s announcement of new international trade tariffs.
→ In mid-May (as shown by the arrow), the median line acted as support. However, after reaching the upper boundary, bullish momentum faded. As a result, the PLTR price has failed to hold recent highs and has fallen back below $130 — with market participants seemingly viewing the stock as overvalued, evidenced by false breakouts above previous peaks.
Given the above, it is reasonable to assume that PLTR may undergo a deeper pullback — potentially towards the median of the channel or even its lower boundary.
This article represents the opinion of the Companies operating under the FXOpen brand only. It is not to be construed as an offer, solicitation, or recommendation with respect to products and services provided by the Companies operating under the FXOpen brand, nor is it to be considered financial advice.

PLTR Fails The BreakoutI've been a bag holder of NASDAQ:PLTR from $9. Don't give me too much credit; I bagheld down to $6. I still have the shares but as it makes an attempt to break the prior All Time High this week will close in failure = bearish.
When price makes a shot to a new major high or especially new ATH its of utmost importance that it follow through. You need that reckless YOLO abandon of buyers willing to buy the new highs and give a solid closing price for the Week above what was the prior ATH. That failing to happen is the most bearish of signals.
To that end; Puts... I consider them hedges on my shares taken out to August (for next earnings).

PLTR: Potential for Further Upside in H2 2025Price is showing a constructive, low-volume pullback into rising EMAs - a healthy sign within an ongoing uptrend as long as price is holding above 118-110 support zone.
Daily trend structure:
Macro trend structure (Weekly):
Thank you for your attention and I wish you successful trading decisions!

PLTR Update My previous post on PLTR hinted at altitude exhaustion under the dome.
Today, a possible abandoned baby forms, adrift at the top of the dome.
Nothing confirmed yet.
But when candles get left behind, they often aren’t rescued.
With NVDA earnings and FOMC minutes tomorrow, the market may reveal its true posture:
Are we in a climb… or simply hovering before descent?
I’m watching 125.05 and 119.90 as silent checkpoints.
If they fail, the dome narrative resumes.
Patience. Observation. Stillness.
Let the tape speak first.

PLTR eyes on $133.37: Golden Genesis fib that could mark a TOP PLTR with a ferocious recovery from tariff tantrums.
Bounce into All Time High has hit a Golden Genesis fib.
It is in tight confluence with a Golden Covid for strength.
$133.27 is the exact Golden Genesis fib.
$129.74 is a Golden Covid fib reinforcing.
$121.86 is the first strong support below.
Previous alert given at sister Golden Below:
=================================================
.

PLTR WAIT FOR THE CRACK!The double top is complemented with a bearish rising wedge stuck in a rising bearish F flag.
A straightforward, short setup if you wait for the CRACK!

PLTR, It's Been RealAt a high of 125, it's had a great run, but a double top has formed going into earnings and a US government which may be forced into austerity. Insiders have been selling for months with no net buys
- First Price target down to the neckline at 76
- Next price target would be 42 for the last real breakout test
- Final PT would be 24 if the double top played out completely

Long Position as AI Growth Accelerates
Targets:
- T1 = $128.00
- T2 = $132.50
Stop Levels:
- S1 = $119.00
- S2 = $112.50
**Wisdom of Professional Traders:**
This analysis synthesizes insights from thousands of professional traders and market experts, leveraging collective intelligence to identify high-probability trade setups. The wisdom of crowds principle suggests that aggregated market perspectives from experienced professionals often outperform individual forecasts, reducing cognitive biases and highlighting consensus opportunities in Palantir Technologies.
**Key Insights:**
Palantir Technologies remains at the forefront of artificial intelligence and big data analytics. Its high-profile government contracts and partnerships highlight a strong moat in the defense and intelligence sectors. Traders note its growing influence in commercial operations as companies expand their reliance on AI-driven predictive insights. Despite trading at a premium valuation, Palantir's positioning in critical industries such as national security and commercial AI adoption underscores its long-term growth potential. Furthermore, its inclusion in the S&P 500 has garnered increased visibility and liquidity from institutional and retail investors alike.
The company's ability to innovate and monetize its AI capabilities has kept investors engaged, especially as the global demand for advanced analytics surges. However, heightened valuation concerns amidst broader market volatility could introduce near-term swings. The $125.50 resistance level is critical — breaking above it could catalyze a fresh rally.
**Recent Performance:**
Palantir's stock has been consolidating within a tight range near all-time highs, supported by robust demand for AI-powered solutions and high-profile commercial wins. The inclusion of Palantir in the S&P 500 has helped sustain bullish momentum, with upward market moves closely aligned to global defense spending and technological adoption trends. Its gradual climb remains accompanied by consistent volatility, serving as an opportunity for both momentum and swing traders.
**Expert Analysis:**
Analysts uniformly agree on Palantir's growth trajectory being tied to AI monetization and defense innovation. Long-term shareholders highlight its role as a strategic player in critical industries, while traders see the current price action as offering a favorable risk-reward setup, particularly with the AI sector signaling sustained momentum. While valuation remains elevated compared to peers, the bullish narrative leans heavily on future revenues from defense contracts and European expansion, especially given geopolitical uncertainties that necessitate advanced analytics.
**News Impact:**
Recent global developments, including increased defense budgets and heightened interest in AI-driven platforms, have bolstered Palantir's market positioning. European countries adopting advanced analytics tools for defense and manufacturing have widened Palantir's growth runway. Its manufacturing OS designed to streamline operations amidst tariff and supply chain complexities highlights its innovation in addressing global economic challenges. Bolstered by institutional support, including significant stakes held by BlackRock, the stock's inclusion in the S&P 500 further amplifies its long-term visibility.
**Trading Recommendation:**
Given its positive market positioning and sustained bullish sentiment, a LONG trade on Palantir appears well-founded. The $125.50 resistance level is pivotal — a breakout could open the path to T1 ($128.00) and T2 ($132.50). Traders should carefully monitor $119.00 and $112.50 as stop-loss levels, ensuring the trade remains favorable in events of downside risk. While the valuation might limit broader institutional growth, Palantir's dominance in AI-powered analytics signals a strong upside potential for the near term.

[PLTR] break out trendline set up (daytrading) On the H1 chart, we can see a breakout of the downtrend line followed by a retest — a sign that the uptrend is continuing.
I opened a call option near last trading hour today, depending on what I feel comfortable with tmr i would close the position
I won’t hold overnight since the option expires this week.

Palantir: The Wisdom of the TrimEvery bull run carries within it the seed of its own rebalancing.
Palantir (PLTR) has ridden the wave of AI narrative, defense tailwinds, and a well-timed alignment with rising geopolitical risk. The market responded accordingly: momentum. Volume. Euphoric belief.
But here we are.
a) Valuation at historically stretched P/E levels—difficult to sustain unless earnings catch up fast.
b) Insider sales quietly ticking higher—rarely a conviction vote.
c) Enterprise demand rising, yes, but already priced in. Corporate contracts no longer come as a surprise; instead, they meet established expectations.
This isn't a bet against the mission. Palantir's pricing aligns with the fragmented, contested, and algorithmic world we're entering.
But... pricing something correctly for wartime does not mean it's immune to peacetime profit-taking.
Technically, the arc is bending. Below the dotted roofline, there is a gentle roll. Support zones await below.
The wise take partials not because they’re bearish...
But because they understand gravity.
Trim the position. Not the conviction.
...

Potential W PLTRWeekly has a double top formation but if it can survive and not retrace much more than 30-40% from the top it could play out a W pattern which is one of the most bullish around

PLTR - Consolidation before run or ready to fall ?Lots of short setups have started to appear and unfold those last 2-3 days, like NASDAQ:AAPL , $V, NASDAQ:CROX , NYSE:RDDT , etc. this could indicate that the "90 day Tariff truce" rally is coming to an end.
NASDAQ:PLTR made a nice break lower yesterday but today's rise seems for now like a counter trend move.
So, I'm playing this very simple:
As long as price is below 125.45$, I'm holding a short position.
A convincing break above that level, increases chance that this breakout might take this higher, so look for long setups.

PLTR: Reversal trendOn PLTR we can see that we are in a bearish trend with a succession of many red candles also accompanied by many red volumes. On top of that we are below the vwap indicator. This implies that we must be careful and vigilant. Indeed, given this chart configuration we would have a high probability of having a reversal of the trend (bullish trend). This will be confirmed by the strong break of the resistance line as well as the vwap indicator by a large green candle and followed by a large green volume.

PLTR: coming up on a major topPLTR had a bull run for the history books. But the momentum is coming to an end for the time being. RSI has major bearish divergence. Wave moves are as textbook as it can get. We should see a small move to complete the Intermediate degree wave 3 and start a correction for intermediate degree wave 4. PLTR corrections can be fairly brutal. Somewhere between 20% to 50% is not unusual for this stock. It is going to be another opportunity load up at $90-$80 levels and get another 100% return for wave 5 run. Overall markets are getting primed for a correction. The hardest decision will be the question of where to put cash to work.....That is a worry for later. Now I am getting out of PLTR.

$PLTR Tradespoon – Long Entry $126.55Tradespoon model generated long signal for NASDAQ:PLTR . Predicted range: $126.55–$134.02. Trend: +0.62%. NASDAQ:PLTR


Harmonic Shark Pattern and Palantir's Stock CorrectionBased on harmonic analysis, specifically the Shark pattern, the price of Palantir (PLTR) stock may face a potential decline from the $129 mark.
This projection hinges on the identification of a completed Shark pattern, indicating a possible reversal zone.
Within this framework, the Fibonacci ratios of 0.88 and 1.138 are critical levels to observe.
The 0.88 retracement level suggests a potential area for a first retest and possible bounce, while the 1.138 level represents the pattern's leading edge, indicating a possible reversal point after a more significant extension.

Quick View: $PLTR- Bullish flag on the hourly chart
- Bullish scenario on the daily chart
- Volume is decreasing
Area of $134 as key resistance.
Support → $118

Is the push-up for PLTR over?Is the push-up for PLTR over?
Palantir stock has been supported by the ascending trendline shown on the chart for the past two days... hence acting as a good support.
The asset pushed up yesterday, but dropped a bit after hitting the descending TL acting as resistance, as shown.
VIEWS for entry
1. Enter with current market price
entry: $121.8
SL: $118.8
TP1: $133.8
2. Be conservative for a breakout
entry: $124 zone
SL: $120.9
TP2: $134
The two trades
RR 1:3.84 & 1:2.55

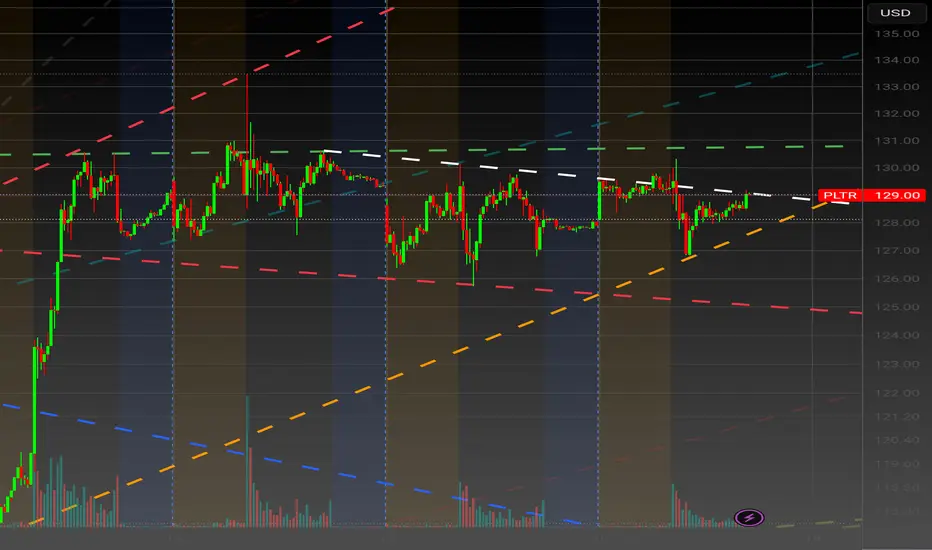
Chapter 9: “The White Line Breach”For days, the NASDAQ:PLTR battlefield stood frozen under the shadow of the white dashed resistance—an angular ceiling forged from hesitation, indecision, and algorithmic hesitation. It was the Interference Veil, where countless bullish advances had been halted and turned back by automated sentries and institutional watchers cloaked in silence.
But on this day, at 129.12, the veil trembled.
The Bulls had not retreated. They had regrouped—silently accumulating forces along the orange trench of rising support, camouflaged by volatility and misdirection. With perfect timing, they synchronized their move. And then...
The breach .
A violent yet precise upward strike—piercing the white line. Not with brute force, but with surgical precision. Candles flared upward like tracer rounds, slicing through the thin air of resistance, signaling that the containment dome had cracked.
The Bears scrambled, shocked. Their white line had been their defense perimeter. Now, it glitched.
The Bulls didn’t just want victory—they wanted altitude. The moment they broke the veil, momentum algorithms triggered. Buyers flooded in, pushing the price toward the green gates of 130.00—the Gateway to the Terror Dome. A final boss battle awaited beyond it.
Below, the orange support line remained intact—an unbroken lifeline channeling bullish energy upward. The breach wasn't a climax. It was a signal flare.
Something bigger was coming.
...to be continued to Chapter 10: The assault on $130.50...
PLTR LONG SETUPPLTR breakout C&H, Sell Climax at bottom of cup, breakout, Flagging on low volume outside the breakout, Looks like we are getting a nice move soon, watching for that flag to break out on lower TF.
