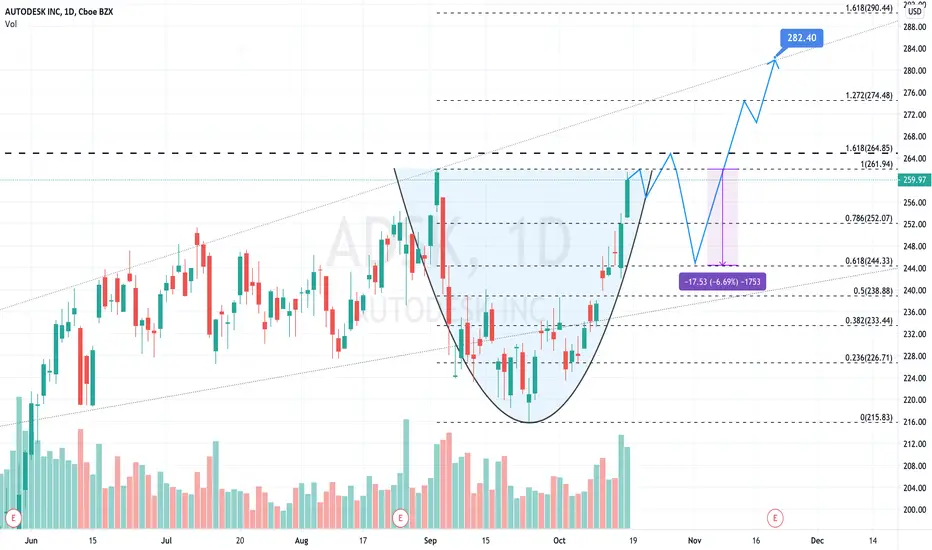
Cup formed, handle next, run into earningsUpdating my ADSK idea from a few days back which has played out nicely. This has formed a nice cup and considering 1. the bullish week it had and 2. the fib retracement (1) and extension (1.618) immediately above, it should bounce off resistance to begin forming the handle. I am reticent to predict an exact path but I think there is a good likelihood that consolidates below, potentially creating a proportional handle at 30% of the cup, before moving upward to new ATH in a pre-earnings run up.
In the past version I had incorrectly listed the 1.618 extension by a point and have updated it to 265.85. I have also updated the upper trend line and fib extensions above.
0HJF trade ideas
Support of a volume shelf with a clear path upwardAfter consolidating, ADSK has the potential for a technical-based move upward to the top of this trend line.

$ADSK Potential Breakout $ADSK forming well defined cup bas and with good volume and seems ready to run before earnings


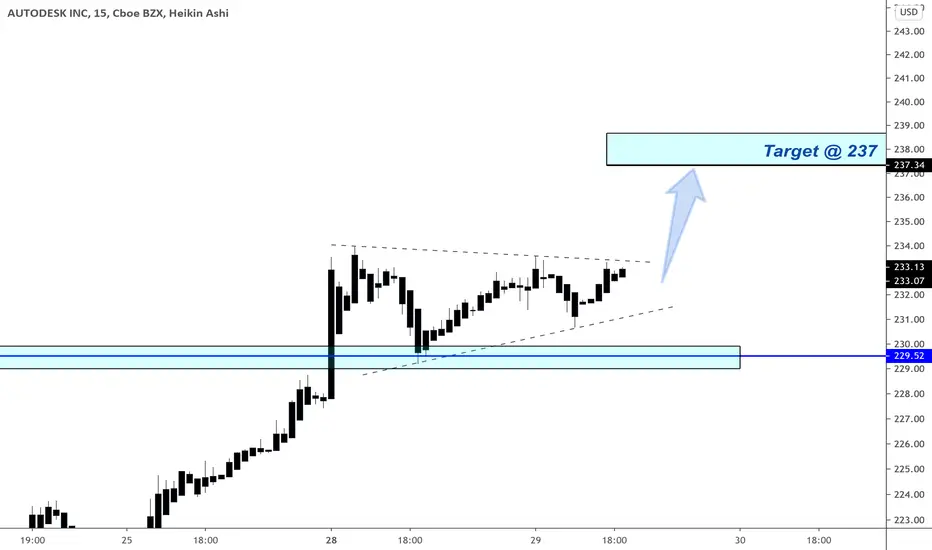
*Day Trade* on ADSK with CALL OPTIONSThis is more for education on options. I pretty much never post my day trades, but please let me know if you're more interested in day trades in addition to position trades. I used Heiken Ashi candles because 15 minute candles on stocks are usually too messy. Heiken Ashi candles smooth out the price action so it'll be easier to visually see the structure.
Execution:
I bought Oct 16 232.50 calls for $8.31 (for those that don't know, each option contract is 100 shares, so that's $831 per option). I expect to be out of these by today, or no later than the end of this week.
Here is a link of the options contract: finance.yahoo.com
I will post my profit or loss no later than October 16th (option expiration), but most likely by week's end (my expected exit).
This is a chart I posted the other day on the stock AEM that I also traded with options. I am still involved in the trade:
PLEASE LET ME KNOW IF YOU ARE INTERESTED IN LEARNING MORE ABOUT TRADING WITH OPTIONS JUST LIKE THIS IN THE COMMENTS SECTION.
ADSK - Elliott wave analysis Welcome guys,
CycleWave is the top author sharing trade ideas based on EW analysis since last four months on the global stocks, currency pairs, cryptos, future indices and commodities.
ADSK - It has completed impulse at major swing high and now correcting down in WXY correction, where X is progressing in ABC where 5th of C of X wave is in progress, which can extend higher too. so wait for it to complete before reversing it for Y wave down.

Oversold, in a broadening formationADSK has nearly tapped ATH recently and fell down with the market weakness. It seems to have rallied and looks oversold. Fib retracement was done from recent swing high to low, levels included. Ideally an open at or above the current level right at the fib would backtest and hold, providing ideal entry.

$ADSK broken out of range, has space above ATH$ADSK has recently broken out for all time highs after a 35 year history. This could break higher and continue to run alongside other cloud names. RSI >60 reflects recent moves while showing there's more potential upside ahead.

🖌️ ADSK 8/31-9/11 Trade Plan 🖌️ Long
-Above @245 and we'll see @250.03.
-Holding over 249 and we'll retest that @253.47-254.40 and @259-265 (ATH price target)
-SL @243.15
Short
-Below @243
-PT @239.40-238.60, and rock solid support @234.75-235.00
-SL @245.15


$ADSK Autodesk Earnings Trade
Potential entry @ $254
Upside target to $280
Always a risk into earnings.

C&H Rising WedgeEarnings 8-25 amc
Not a recommendation
Rising wedges are long term patterns but have a bearish bias

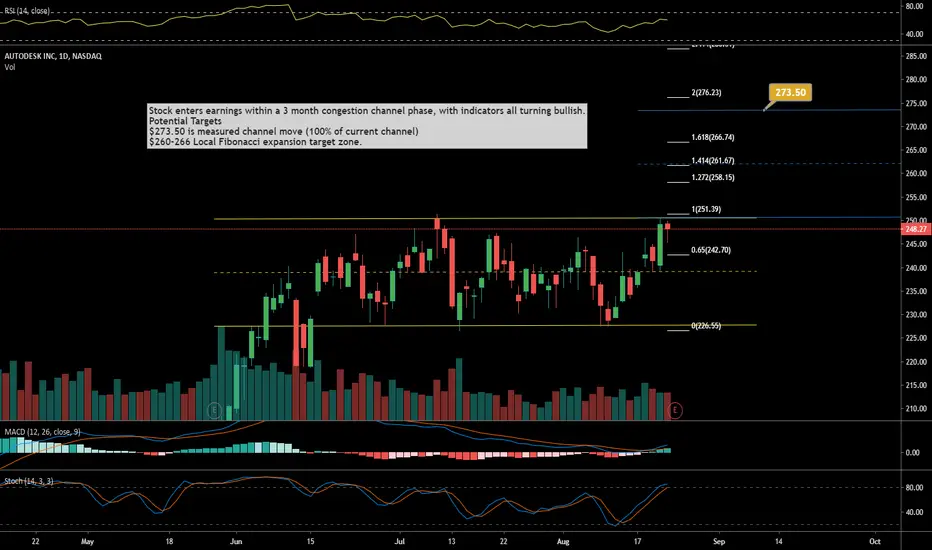
$ADSK Autodesk Earnings Bullish Targets
Stock enters earnings within a 3 month congestion channel phase, with indicators all turning bullish.
Potential Targets
$273.50 is measured channel move (100% of current channel)
$260-266 Local Fibonacci expansion target zone.
PLEASE GIVE US A LIKE IF YOU FIND OUR CONTENT HELPFUL, THANK YOU.


TTD ADSK7.9.20 TTD ADSK In this video I discussed more market dynamics in both of these equities. TTD is definitely a bullish market that is making new highs and has no structured that suggest resistance because there is no resistance based on the past and this has certain challenges to it. There are certain details that might be of interest, things we can look for, not as an absolute commitment that they will happen, but we have a chance to analyze previous behavior and what future behavior might look like. I will follow up on this chart regardless of what happens after today. ADSK similarly has made all-time highs and has no resisting structure, but it does have behavior from the past which is very important to recognize in my opinion, and if you had recognizes behavior you have a way of interpreting the market and taking advantage of this market when it was trading around structure, and for that reason it's worth looking at ADSK. I did not have time to talk about the current transitions in ADSK which actually give us some information that we can work with, but I will address this on a future video.

C&H Past Breakout AutoDesk broke out a little while back from the cup and handle pattern
Possible Targets? 247, 264, 274
Target 2: 320 to 350


Breakout Algo Buy SignalNot Trading or Investment Advice!!!
My breakout algo issued a buy signal on 6/5.
Buy at 233.71
Wait for update on exit price
Risk control:
use 3% of portfolio capital
