Beazer Homes Stock Chart Fibonacci Analysis 051525Trading Idea
1) Find a FIBO slingshot
2) Check FIBO 61.80% level
3) Entry Point > 22/61.80%
Chart time frame: D
A) 15 min(1W-3M)
B) 1 hr(3M-6M)
C) 4 hr(6M-1year)
D) 1 day(1-3years)
Stock progress: A
A) Keep rising over 61.80% resistance
B) 61.80% resistance
C) 61.80% support
D) Hit the bottom
E) Hit the top
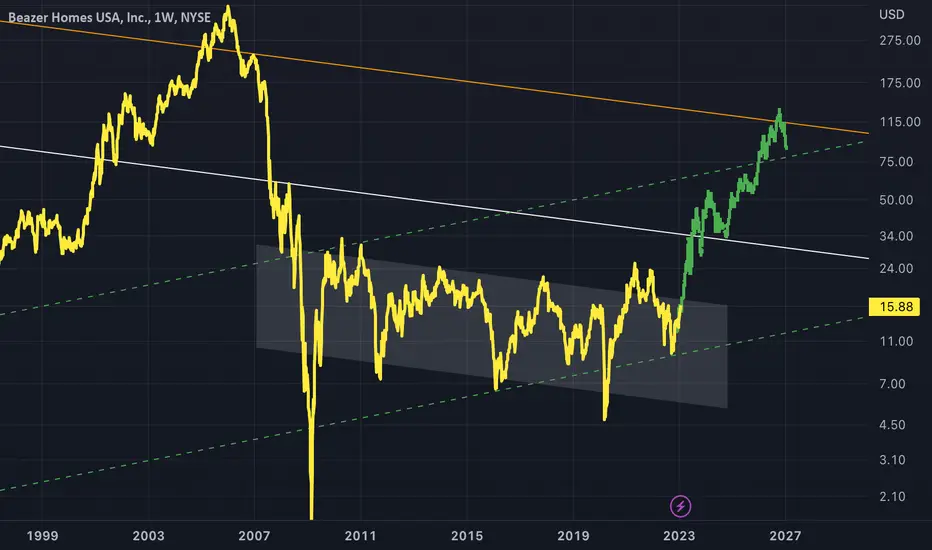
Stocks rise as they rise from support and fall from resistance. Our goal is to find a low support point and enter. It can be referred to as buying at the pullback point. The pullback point can be found with a Fibonacci extension of 61.80%. This is a step to find entry level. 1) Find a triangle (Fibonacci Speed Fan Line) that connects the high (resistance) and low (support) points of the stock in progress, where it is continuously expressed as a Slingshot, 2) and create a Fibonacci extension level for the first rising wave from the start point of slingshot pattern.
When the current price goes over 61.80% level , that can be a good entry point, especially if the SMA 100 and 200 curves are gathered together at 61.80%, it is a very good entry point.
As a great help, tradingview provides these Fibonacci speed fan lines and extension levels with ease. So if you use the Fibonacci fan line, the extension level, and the SMA 100/200 curve well, you can find an entry point for the stock market. At least you have to enter at this low point to avoid trading failure, and if you are skilled at entering this low point, with fibonacci6180 technique, your reading skill to chart will be greatly improved.
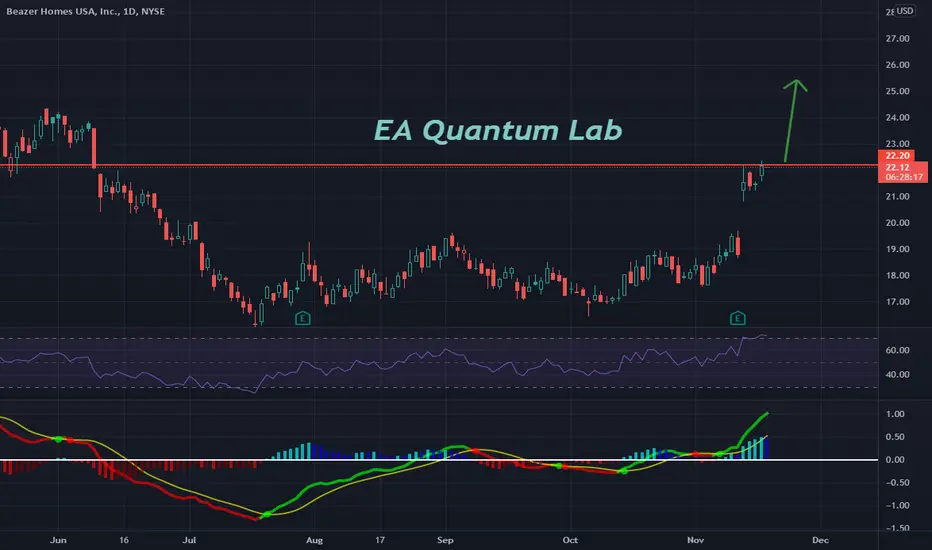
If you want to do day trading, please set the time frame to 5 minutes or 15 minutes, and you will see many of the low point of rising stocks.
If want to prefer long term range trading, you can set the time frame to 1 hr or 1 day.
0HMG trade ideas

BZH - Recovery IdeaPrice is within a down channel but is trying to move to the upside
IF an upside break occurs a buy is in order as price may like to recovery to where the prior drop occurred
This is another symmetry post
Potential bullishness
BZH - Another Homebuilder Short Setup If indexes go lower then Homebuilder stocks are going to get smashed. Rising interest rates do this sector 0 favours.
Anyhow here's a tasty short setup.
BZH has had a double top bounce to first print a star candle then an evening star candle formation shakeout reversal patterns through the log 0.618 retracement from the previous high.
In addition there is a tunnel gap connected through both tops and there is another very large gap below - that means this is a very unstable bounce.
If this is a major pivot BZH has a DEEP fall ahead.
Easy when you know how... 🧐
Not advice.

BZH Lower We will get a slew of housing data next week which will send shock waves throughout the housing market. I believe we get very weak housing starts and home sales numbers. My pessimistic belief for this data is derived from the fact that interest rates are at 3 year highs. Interest rates have a big impact on financing costs for homes, when financing costs rise home prices and new builds tend to fall.

BZH potential rebound from current priceBZH is on weekly support that potentially bounce up from current price. Take profit on about 25% gain. Keep in mind to have cut loss level.

LongGood accumulation. On a breakdown upwards. Do not forget the stop loss!
❤️ If you find this helpful and want more FREE forecasts in TradingView
. . . . . Please show your support back,
. . . . . . . . Hit the 👍 LIKE button,
. . . . . . . . . . . Drop some feedback below in the comment!
❤️ Your Support is very much 🙏 appreciated!❤️
💎 Want us to help you become a better Stock trader?
Now, It's your turn!
Be sure to leave a comment let us know how do you see this opportunity and forecast.

BZH: Was $411, now trading under $19 with good fundamentals.Do your own research, but here is what I found.

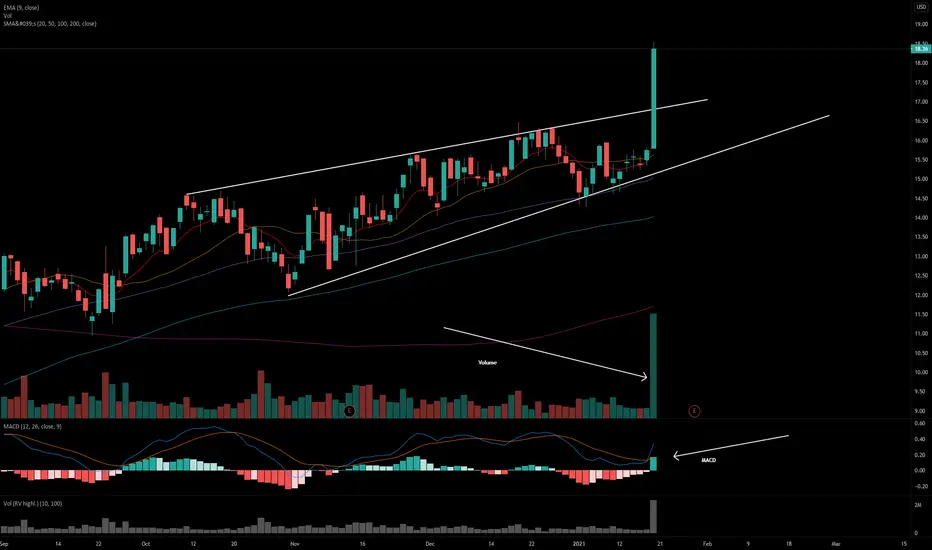
rising channel on daily, bullish homebuilder sectorThe homebuilder sector etf was up .75% on friday, despite rest of market being red. BZH has rising channel on daily, resistance would be $14.44 in this channel. Over 4000 $14 calls sitting in OI for 10/16. Fibonacci .618 is $15.4. Everything is dependant on Trumps health. Happy trading

BZH longDon't pay heed to Zacks - this has a Zacks rank of 5, it doesn't get any worse, yet here I am 4.3% up. I used to pay attention to Zacks, never again.


Beazer Homes more downside aheadBeazer is heading to 2.50ish level. Right now we are in the $10s.
Short the crap out of it.


$BZH IdeaLooking for up trend within the channel. If it breaks to lower support might be good opportunity to double down. Always take an options position for put to protect yourself from downward movement.

Intersector Spread Trade 2/2PAIR THIS TOGETHER WITH CAVCO. One long one short. give it a few months :)


BZH RSI Divergence ShortBZH price action is hovering below the 200sma as we enter 2017. Prices have already completed a 2 leg measured move to $15 and retraced to the 34EMA. A 3rd leg has formed and offers a possible RSI divergence trade near the 200sma level. The confluence of 2 levels, along with the 3 push wedge pattern is strong. Set an alert @ $15.50 and watch.


BZHGOOD RISK REWARD: BREAKING TREND
GOOD FINANCIALS.
SMALL FLOAT
BOUNCING FROM FORMER SUPPORT IN THE MONTHLY CHART.*

BZH Breakout of Head & Shoulders or Cup and Handle?Short, Medium, and Long Term price predictions on Chart
