Jack Daniels has never done this...Brown Forman (the company that owns Jack Daniels) has NEVER hit the 200 SMA on the monthly.
Liquor has just completed a 50%+ pull back .
If Trump gets elected, tariffs will increase causing international markets to take a bit of a nose dive, but this company looks ROCK solid fundamentally.
Strong buy
0HQ3 trade ideas

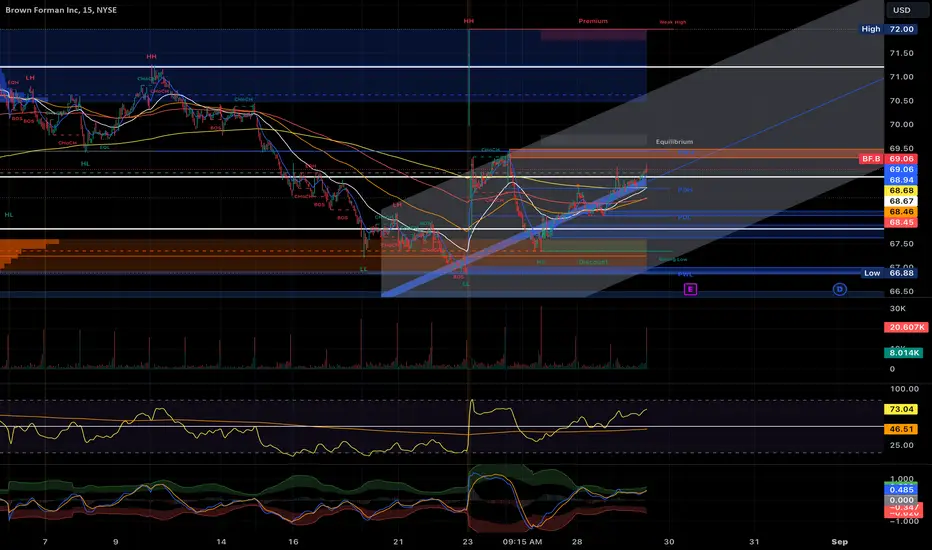
Brown forman is going to $67 soonBrown forman is going to $67 soon
the price action looks good
bottom is in

$BF.B earnings play All my technicals are pointing upside….the sell off at close is for the earning tomorrow BEFORE open. If earning are good i expect this keep moving back $70. I want to see if i cant get an entry around $39. If the earnings and future guidance are blah or less than spectacular i could see a return to $38.50. Also that looks like a bullish cypher on the chart which is pretty much an double bottom just stretched out. I like the setup both directions.
$BF.A with a Neutral outlook following its earnings #Stocks The PEAD projected a Neutral outlook for $BF.A after a Negative Under reaction following its earnings release placing the stock in drift D with an expected accuracy of 75%.

$BF.B with a Bullish outlook following its earnings #Stocks The PEAD projected a Bullish outlook for $BF.B after a Positive Under reaction following its earnings release placing the stock in drift A with an expected accuracy of 83.33%.

Brown-Forman USA Sun Storm Investment Trading Desk & NexGen Wealth Management Service Present's: SSITD & NexGen Portfolio of the Week Series
Focus: Worldwide
By Sun Storm Investment Research & NexGen Wealth Management Service
A Profit & Solutions Strategy & Research
Trading | Investment | Stocks | ETF | Mutual Funds | Crypto | Bonds | Options | Dividend | Futures |
USA | Canada | UK | Germany | France | Italy | Rest of Europe | Mexico | India
Disclaimer: Sun Storm Investment and NexGen are not registered financial advisors, so please do your own research before trading & investing anything. This is information is for only research purposes not for actual trading & investing decision.
#debadipb #profitsolutions


BFB - Brown-FormanCAPITALCOM:BFB
Idea is simple:
Long position from the current price ($71.1) (you can w8 to close higher than 71)
Stop - $70.3 (-1% risk)
Profit - 3 takes:
1st take $73 (2.8% upside)
2nd take $77 (8.3% upside)
3rd take $82 (14.7% upside)
Profit/Risk - from 2.8 to 14.7
You can split position to 3 parts, for each take
Feel free to comment / add a feedback

Brown-Forman CorpChart pattern: Bull flag
Entry: 82.24$ (this would end the secondary downtrend of the correction)
Stop: 67.74$
Target: 106$-130$
Stopmanagement: SAR Parabolic weekly Chart default settings
Risk:Reward-Ratio: 1.4:1

Brown Forman Long term analysis of Brown Forman, will probably break out of symmetrical triangle this summer. $130 Targets before we look to restest 200ema weekly.

BUY to BROWN-FORMAN CORP DailyHello traders, BROWN-FORMAN CORP is in a bullish configuration with a candle carrying water and stable volume traded. On the TIMEFRAME M1 we see a hammer candle upside down with a large negotiated purchase volume, it is heading towards its last lower precedent. To fill a bullish breakout gap, swallow it goes to the various points of the bolinger to check them. And come to the top of the consolidation in order to retest it, a great possibility of breaking the price with momentum.
Then then the zone for arrival on the one above and go to the next top. With a higher (on TIMEFRAME H1) Before filling a bearish breakout gap, but another is trying to pass (View of TIMEFRAME H4). After his resistances give up the breakout of a consolidation zone will be made. Little buying power to test the motie of the intermediate median of ANDREWS PITCHFORK.
Please LIKE & FOLLOW, thank you!

the b[AI]te's weekly insights -- BF.B 2021-02-08center stage image
stock
our system found that BF.B received the best image over the course of last week.
comment image
we see a strong positive correlation with our image indicator. We therefore assume that prices are driven emotionally and might not reflect an accurate picture of the companies current state of affairs.
new free tool
we launched our new free analysis tool. Check our website and test it out!
new free and powerful data API
you can now access our data via our free API . Check our website and test it out!
FAQ
ATTENTION
our algorithms define ATTENTION as the overall number of stories and opinions that appear for a given security each day.
IMAGE
our algorithms define IMAGE as the averaged sentiment value extracted from all opinions received for a given security per day.


$BF.A with a slight bullish outlook after earning releaseThe PEAD projected a slight bullish outlook for $BF.A after a negative over reaction following earning release placing the stock in Drift C
If you would like to see the Drift for another stock please message us. Also click on the Like Button if this was useful and follow us or join us.

BUY to BROWN-FORMAN CORP Hello traders, BROWN-FORMAN CORP is at a very important moment in its history, we can witness a new historical high. BROWN-FORMAN CORP is in a fake bearish push with a high volume of sales made, we can see on the candle a rejection of the sellers. On the TIMEFRAME 1min ongoing bullish continuation strong potential to go on the next highs. And if in the long run we are holding more than half of the stabilization zone, then we have a high probability of breaking out the zone. To arrive in another and find a new historical high.
Please LIKE & FOLLOW, thank you!

Brown-Forman (BF.A) Boasts Bull Flag Set-Up Nice flag consolidation taking place here two days before earnings. Well worth a punt ABOVE 67.20, eyeing 68.15.

Analysis on Brown-Forman CorpHas essentially hit its ATH... and broke through Resistance 2. Great looking price action. I would anticipate someone currently long would have a target of $74.
Currently very expensive and one would be well suited waiting for the price to come back to a support level prior to chasing this price.
Very expensive, but still appears bullish.

Brown Forman Corp BreakoutEntry level $ 65.50 above Fib 1.272 extension.
Target price $69.00 below fib 1.618 extension
Stop loss $64.50 below breakout.
Company profile
Brown-Forman Corp. engages in the production and distribution of alcoholic beverages. The firm offers whiskey, scotch, tequila, vodka, liquer, and wine. Its brands include Jack Daniel, Woodford Reserve, Old Forester, Early Times, Canadian Mist, Coopers' Craft, Slane Irish, Finlandia, Korbel, El Jimador, Sonoma Cutrer, and Chambord. The company was founded by George Garvin Brown III in 1870 and is headquartered in Louisville, KY.

BF.B (BF B)System T Performances: Annual Compound Profit 40%, Win Rate 55%, Risk/Reward Ratio 1:2, 20 Years of Backtesting Data, Over 100 Markets.
* Click Like and Follow to Support My Work!
---
Hi Traders,
I'd like to introduce the System T, a computerized trading system that analyzed and backtested the 20 years history data of over 100 markets.
This post is my sharing of how I think about systematic trading and the signals generated by the System T.
(This is my opinion only, NOT the financial advice.)
I think that for the system to open a trade and manage risk, it only needs a buy signal & a stop-loss signal clearly on the chart.
Once the system finds a good trend, it will ride it as long as possible. The stop-loss will be adjusted accordingly to the new price movement.
(Remember to follow this trade idea and follow my profile to get updates about the stop-loss adjustment and sell signal based on the latest price and market conditions daily.)
System T performances above will give you an idea of how it performs in the last 20 years.
Notice that this result was achieved only if I strictly followed the rule: "Only and Always Buy & Sell based on the System Signals".
Don't sell when there is no sell signal as we all want to follow the good trends til the end like everything in life does. \(^-^)/
Also, my system is extremely diversified through over 100 markets so that it only risks less than -1% of the total capital per trade.
Thank you and good luck!
---
DISCLAIMER:
I am NOT a financial advisor, and nothing I say is meant to be a recommendation to buy or sell any financial instrument.
My views are general in nature and I am not giving financial advice. You should not take my opinion as financial advice. This is my opinion only.
Do your own due diligence, and take 100% responsibility for your financial decisions.
Trading and investing are risky! Don't invest money you can't afford to lose, because many traders and investors lose money. There are no guarantees or certainties in trading.
- Content is for education purposes only, not investment advice.
- Trading involves a high degree of risk.
- We’re not investment or trading advisers.
- Nothing we say is a recommendation to buy or sell anything.
- There are no guarantees or certainties in trading.
- Many traders lose money. Don’t trade with money you can’t afford to lose.


BF.BCountdown 13, trend exhausted.
There is also a flip reverse.
Now it is possible to start a bullish trend .

