CLF on my bear listDon't chase it down right now,
Two lines on the weekly are why CLF is on my bear list
Also, very late to the game in a string bull market.
0I0H trade ideas


CLF: Contrarian OutlookCLF is a buy in my opinion but the price must close above the .786 fib retracement box I have placed in on the chart for a long position to be considered. Noted for a lagging share price to the industry, yet considered a great company with potential. To those trading the steel market, fundamentally the opinion is definitely swaying towards bullish for 2018.
--US housing starts rose 3.3% to a SAAR of 1.297 million units (November) and The Architectural Billing Index rose to 55, both of which are good signs for an increase in the demand and spending on steel. Coupled with the future infrastructure projects proposed by trump signs are looking good.
--Toyota/Mazda plant has just been approved in Alabama, estimating 300,000 vehicles per year starting in 2021.
--Chinese Steel exports have fallen for over 15 consecutive months.
---CLF announced a new HBI plant in Ohio w/ a capacity of 1.6+million tons a year.
For a safe position, i am looking for price to close above the .786 fib as stated above, this would reject the potential pattern i have drawn on the chart. The boxes are calculating +/-2 % variance of the Fibonacci ratios. If we do not see a close above, a daily doji and a bounce of the .786 could be signs for a lower share price. In that case look to enter around 5.70 which seems to be a good support, or look for a completion of the ABCD pattern.

Two technical things in a chart patternFirst this have a double bottom in the pattern at a 5.60 price area
Second This form is a triangle and the price is breaking the resistance line of this triangle and this is a mining company in the basic material industry and the gold, silver and cooper futures are very bullish now. what else do I need to know
This trend line was broken today 01/02/2018 from my weekly point of view and always need to wait for a pullback who retest the line but now from a support point of view the other important aspect here is the line was broken today Monday and I need to wait for a weekly candlestick closing above the resistance line for check that it is a clear breakout and not a bullish trap or whipsaw: but I shared The idea today because there are lot of things here like a very bullish S&P and a weak dollar too combined with a strong gold, these are a very good fundamentals ingredients. The other is the research about the Financial numbers of this company (Earnings, PE Ratio, 52 Week High, etc) but fundamentals is not my job I comply with putting ideas on the table based in technical analysis specially breakout and pullback And this chart meets the requirements
the breakout is happening now and wait for the pullback is the second part of the job
This idea is for a long term trade, swing or even a position trade. Again I repeat the handle of the position is not my job because I only I a Analyst I not a trader but my ideas speak for themselves Look the chart I do not need to draw a lot of lines and display a lot indicators, this is called price action with the use of a very simple technical analysis combined with a clear candlestick interpretation (No fancy names for the candlesticks)
Patience, and weekly charts :(

AB=CD Still learning, just an idea, please let me know if something is not right, thanks. Target Price 7.50


Cross roadsSitting at the trend line, break below possible H&S setup. Hold and back to 9 as long as IO does not break down.


good entry for a swing right here.-Higher highs, higher lows
-EMA 200 is below the price (long signal)
-Uptrend since may
-We are on a strong support
WAIT for the signal that this support holds, before you enter a trade. In my case, thats a good nice green candle.
These three points tell me, we have a good chance that the price will go up again. could take 2/3 swings till we reach the upper resistance.
WORK WITH A TRAILING STOP on this one.
Good trades and heaps of profits to you!


CLF BullishI like CLF, X, and AKS here. These industrial stocks are all in the process of bottoming.
That said, they are volatile and risk is high. Now that CLF has gained the 50ma, I would like to see a new shakeout low and recovery, like what it did in Oct, 2016.
X is, I believe, the most stable ride owing to its higher market cap. It is not as overbought as the others.
Long X, 5% position, 10% stop.
Long CLF, tiny position, will add if I see a shakeout + recovery.

weekly head and shoulderweekly charts are more powerful than smaller time frames, daily rising wedge broke to the down side last two days, toady was a large engulfing candle
on a decent earnings, markets need to confirm downtrend for a multi month correction


Solid Company Broken StockStill think we could see a 30 - 40 % drop over the next month, plan is to start buying if/when that wave goes red.

Needs to hold support (previous resistance)CLF had huge volume movement yesterday with the price breaking out to almost $8. Previous resistance is now acting as support.

Inverse Head and Shoulders forming on short term candlesWith yesterdays breakout to almost $8. It seems CLF is finding support here and consolidating with a inverse head and shoulder formation.

Some crazy movements Would love ot see it back over that trend line, if rejected 3 - 4 bucks as short target for me.

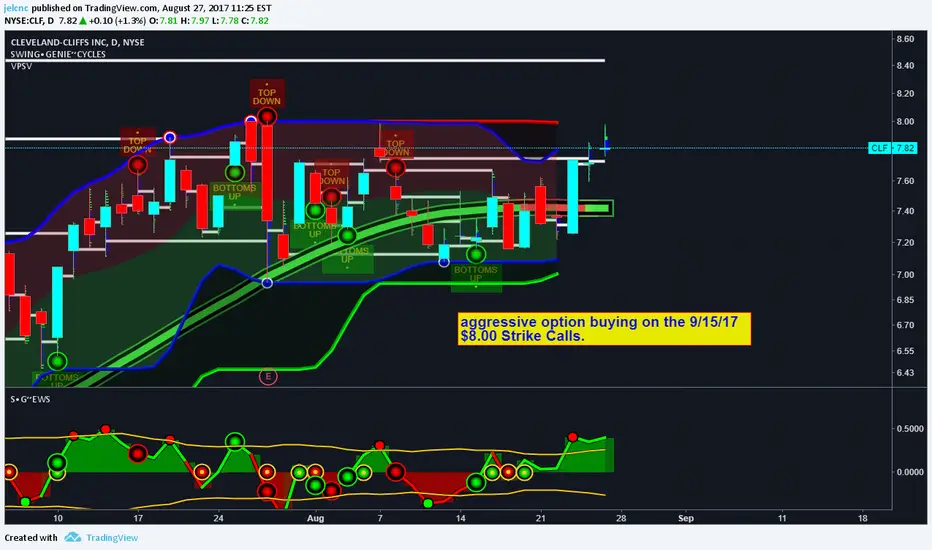
BUY CLFCLF is ready to go up to the $8.4 area and maybe further. Based on the technicals we held the $6 structure area, broke out of a wedge, had an 8/21 ema crossover and then today broke out of new highs, which may result in a pin bar rejecting the previous resistance now support. Also, There is many traders buying calls expiring in the next few weeks speculating on a huge move soon.
