0I0H trade ideas


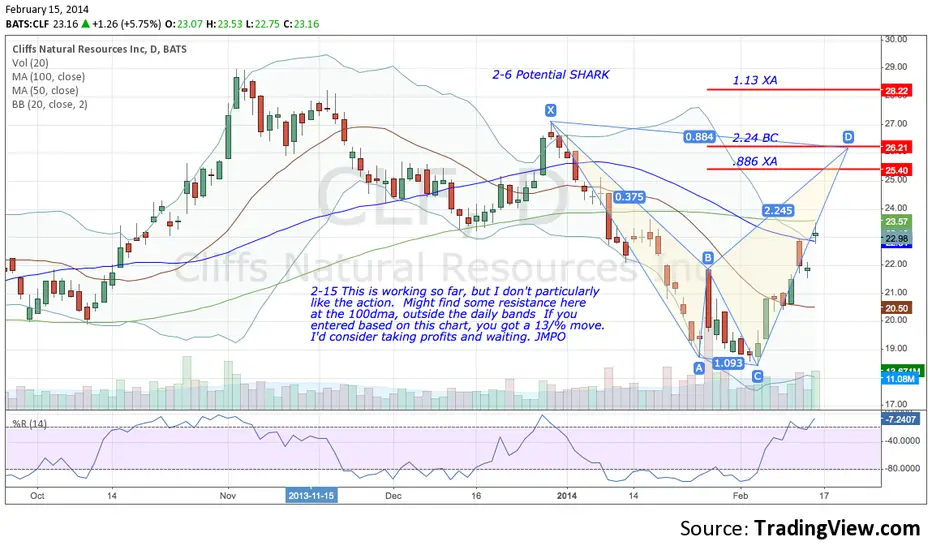
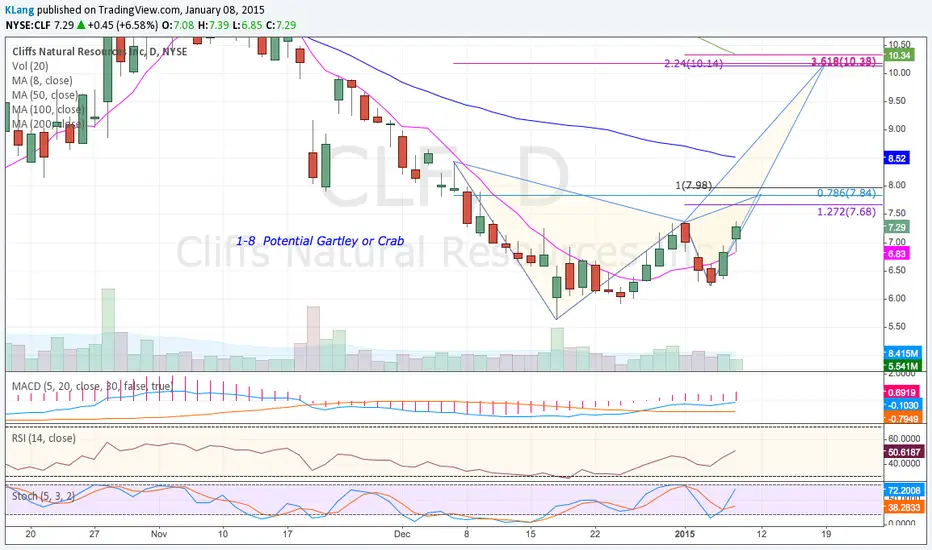
CLF: Profited 33.74% price so far! Have We Hit Our Target?Traders
We've taken 33.74 percent of CLF's ENTIRE price here and made some great money here (Beyond great)... Just by using basic analysis and a dash of common sense.
We're now at a previous support line, could we see target hit here? Or is there more downside level to be had?
Best of luck traders
Tom
Note: Interested in personalised face to face or online trading tuition? Message me on tradingview, or email me on the email address of my profile page.
Thank you.
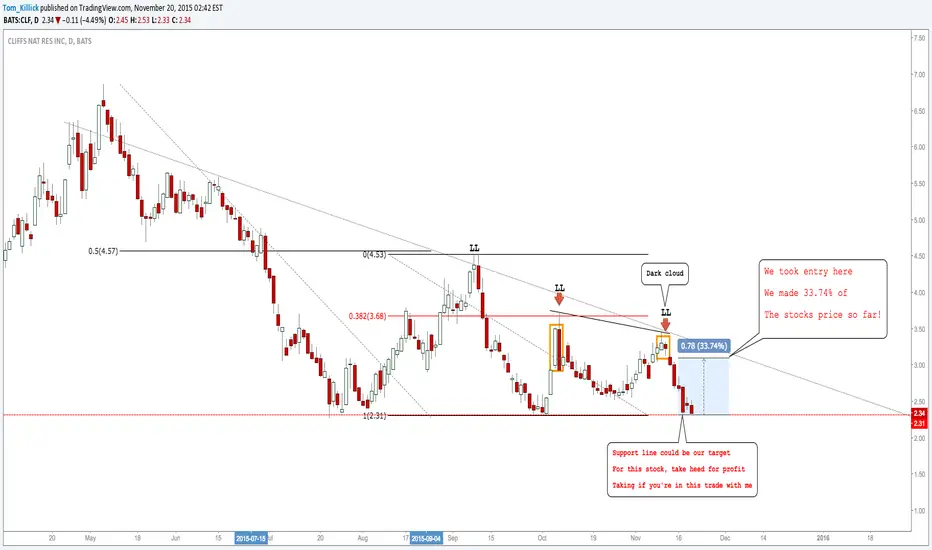
CLF: Shorts Off Action Level #ResourcesTraders
Nice area to short once again here.
Best of luck,
Tom
Note: I offer personalised face to face and online trading tuition to a professional level. Email or message me for details of this opportunity.
Thank you.
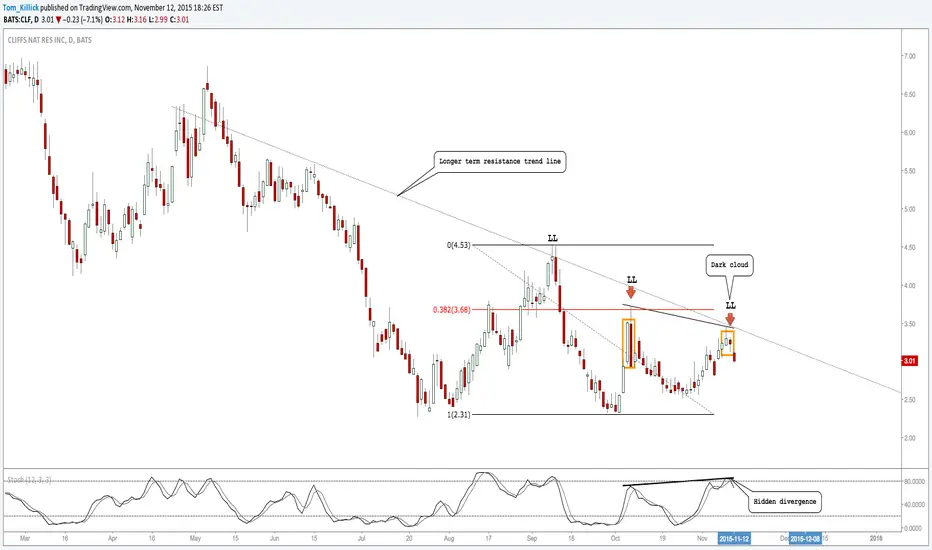
CLF: Still Exhausted, Needs More DownsideTraders,
Looking for a quick high probability trade in this stock. Entered today on the open and plan to hold until at least support unless price moves massively against me. Which isn't likely.
Tom
CLF: Expecting A Downside Move In The Near FutureFriends
CLF is looking good for a short soon, to the downside. It is worth noting that the stock is in the process of a three drivers pattern, and this final leg brings you all into the buying range, so like every time you short a third structure leg, you take profits early, as pin bars, and other shiz are likely to form at these sort of bottoms
This stock is NOT ready to trade now, I expect a resistance retest first, and a nice move down, safer buys are obviously above the short term ascending channel, which co incidentally breaks at the exact same time as the support resistance zone, a zone which is important to break to assure safety and actual bearish enthusiasm into this trade.
If we ttrade above 7.50's, this idea is void.
Regards
Tom

CLF- Waiting For Outcome For Possible Long Or Short TradeFriends,
CLF. There's reasons to go long and short. Depending on what happens in the next few days. Some traders can't handle changing sides in a heartbeat because it defies the natural course of thinking. Almost all traders will have a bias and become attached to it, ignoring what the chart is actually portraying.
Here, if we break 4.50, I'm going short, if we break 5.45, i'll go long. Simples. (Providing we see the right candlestick signals going in those directions.)
Why would I go short if that small internal channel range was broken? If any of you figure it out i'll be impressed.
Good luck traders.
Tom

CLF- I Sense That This Is The True BreakoutWe are seeing advanced bullish tell-tale signs. First target is 50EMA.
If the pre market futures look good, then we have a good trade here :)
Note: This stock has once before tried to make a break before and failed at the 20EMA. But this looks more promising this time.
4.5 risk reward ratio makes it worth a go, as the stop loss can be extremely tight.

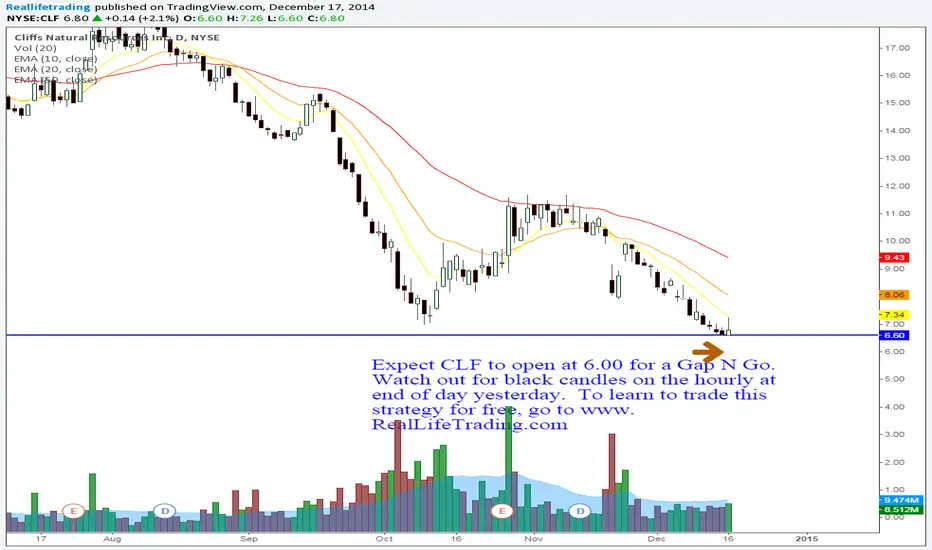
CLF Day Trade (Brad Reed Dec17,2014)Expect CLF to open at 6.00 for a Gap N Go. Watch out for black candles on the hourly at end of day yesterday. To learn to trade this strategy for free, go to www.RealLifeTrading.com
CLF Cliffs' gonna be a teenager (again). Dirty 'ol Cliff!That dirty industry is getting a slight lift thanks to China. IMO this is a trade. I have no position (ever). $16.87 looks like an outlier target. $13.50 looks better for now.

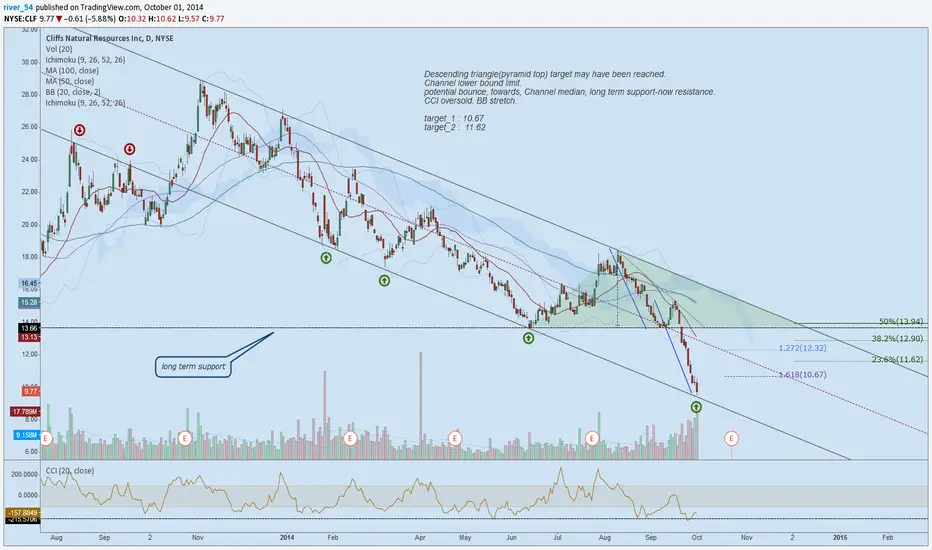
CLF DailyDescending triangle(pyramid top) target may have been reached.
Channel lower bound limit.
potential bounce, towards, Channel median, long term support-now resistance.
CCI oversold. BB stretch.
target_1 : 10.67
target_2 : 11.62
Support-Stop loss : Channel lower bound.
Cliffs Natural Resources Double Bottom: A Buy LevelCliffs Natural Resources Inc (NYSE:CLF) has hit double bottom and is now due for a multi-day bounce. Look for the stock to trade back to $15.00 in the coming weeks. See the chart and this very common and high probability chart pattern...
Gareth Soloway
Chief Market Strategist
www.InTheMoneyStocks.com

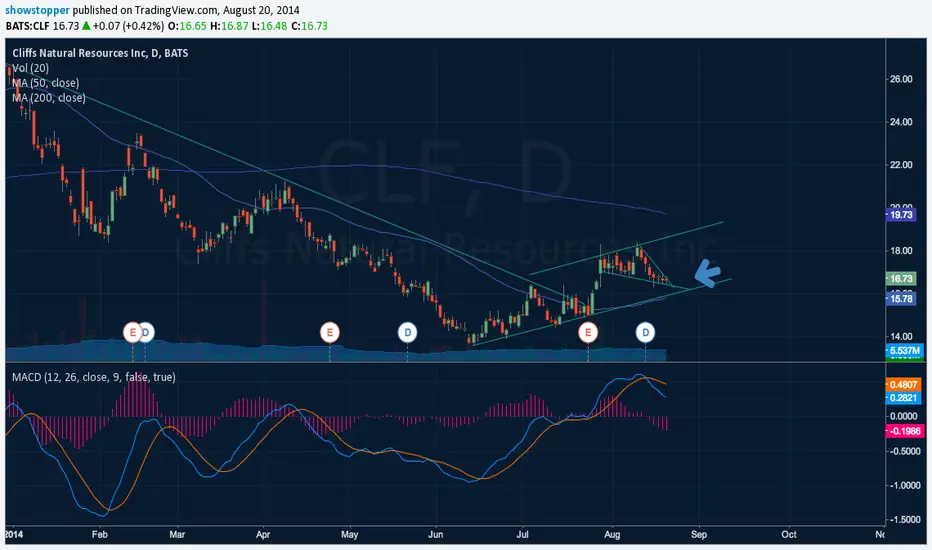
CLF - Falling to a trendline support, then reversalCLF was in a long term strong bear channel that broke out to the upside on a climax in late July and is now in the process of pulling back to retest the trendline.
The test will come at around 14.50. A couple of trendlines support that price and the bear channel will fall right into it.
There is such strong selling that I think the best the bulls will get after the test is a broad trading range (between 16.50 and 14.50).
14.50 is a good buy zone once we see a nice bar/ candlestick reversal

CLF should starting moving up from hereBreaking of wedge, price nearly at lower channel, macd almost curling and getting bullish. Definitely could see 20's soon.
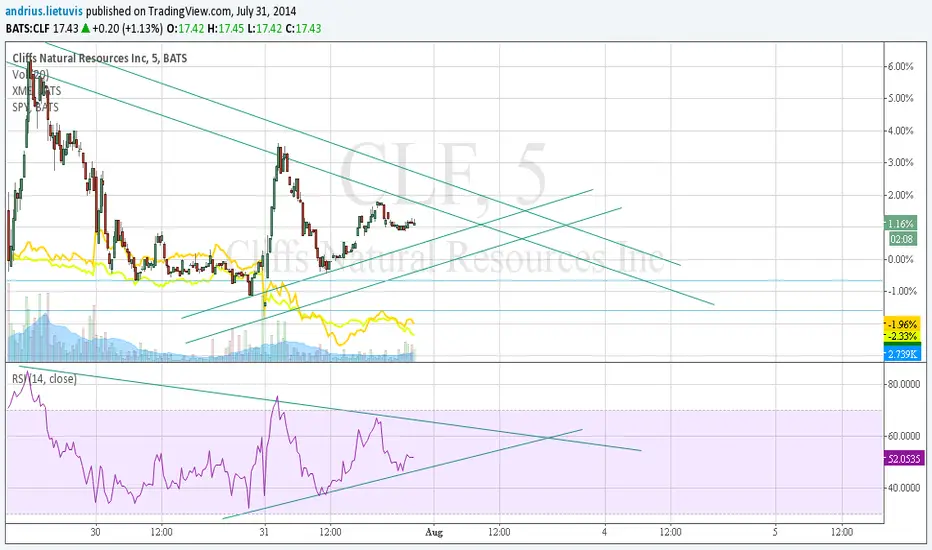
CLF, should we go up or should we go down?Today in first our of the day CLF went up despite XME and SPY was heading down, but eventually stronger wind took his place. Where it will blow tomorrow? Up or down?


CLF - Daily long on bullish divergenceYesterday I posted a chart with my long term view on CLF. Here is the link
Going with my weekly bullish bias, I regard today as a good level to go long because we have :
1 Class A bullish divergence on the MACD
2 slight bullish divergence on the histogram
3 price closed over previous low at 18.50$.
Only worry is the falling volume.

CLF - Transitioning with a Double bottomFirst thing I need to say is that this chart is very long term based, more than one year.
CLF is a mining company that specializes in the mining and beneficiation of iron ore and the mining of coal. Some of its competitors are VALE, BHP and RIO. Its chart is best correlated with VALE. What makes this particular stock more interesting than its competitors (all lost a lot of their value due to the drop in iron ore prices) is the surge in volume. Volume in CLF is double what it used to be 2 years ago, and price is going sideways. This means that someone is buying this stock for some reason. I always thought until now that something important fundamentaly happens and then you can see it on the chart. Well, recently, I started to believe that you can see fundamentals through technical analysis, before the data is released to the public. That might be the case here, cause for some reason, as I said, someone is buying, and it looks like CLF is accumulating.
Looking at the chart, the moving averages and price action is telling us that maybe the downtrend is over, both moving sideways. There is a Double bottom with a huge class B bullish divergence on the weekly chart! This usually is a very strong signal. There is also a slight divergence on the histogram, poiting out that bears lost power.
Major support is around 15, and as long as we stay above, my bias is bullish. A close below this level and I'll have to reasses my plan, and probably cancel it. First target would be 28$, which is the double bottom neckline, and also previous support from November 2013. The Double bottom target is at 40, where there is a strong resistance and a fib level. Further away, major resistance stands at 47$, a level that coincides with a fibonacci cluster.
I never traded for the long term, so I preffer to trade on the daily, keeping my bullish bias from the weekly. I will be posting charts with the daily setups that I see, only on the long side.

Wyckoff Analysis of Cliffs Natural Resources $CLFBarron's published a list of value stocks in this week's edition. There are some nice charts and some ugly ones (see Transocean $RIG). One of the best setups, I'm my opinion, belongs to Cliffs Natural Resources $CLF. I have attached the weekly chart and labeled the classic Wyckoff psychological events. This chart is a classic bottoming pattern with a well defined exit point if $CLF cannot hold price.