CLF Channel PlayThesis: Playing the bounce off of the bottom of this channel. Might dip just a bit more first to $23.
Target: $28
Trade vehicle: 9/17 $25 calls @ $0.54
0I0H trade ideas

CLF modified Head and ShouldersCLF, despite a recent jump in HRC1! steel futures, continues to selloff.
It's day candles reveal a 3-peak pattern commonly understood to be a "Head and Shoulders".
Despite the modified (angled) neckline, I still read this pattern as incredibly bearish.
CLF is also quite close to invalidating a strong 1y trendline (pink) for the second time in the last quarter.
While I personally don't have any interest in a short position for such a fundamentally strong stock, this pattern and support break presents enough concern to dissuade me from taking a long position until sometime in September.
My guess is other technical investors will feel the same!
CLF seems likely to stop selling off at the 21.60 level, which is both the 0.5 Fib zone, as well as the end of the neckline for the Head and Shoulders that have formed.
I will wait for strong reversal confirmation before taking a bullish positions. Any long positions should consider the impact of upcoming earnings 10/22, and look to take profits before then.
Fibonacci time zones call for a local top around Oct 14th, about a week prior to earnings, which aligns with historical price action.
MacD and RSI are both moderately bearish and congruent with the Head and Shoulders bear sentiment.

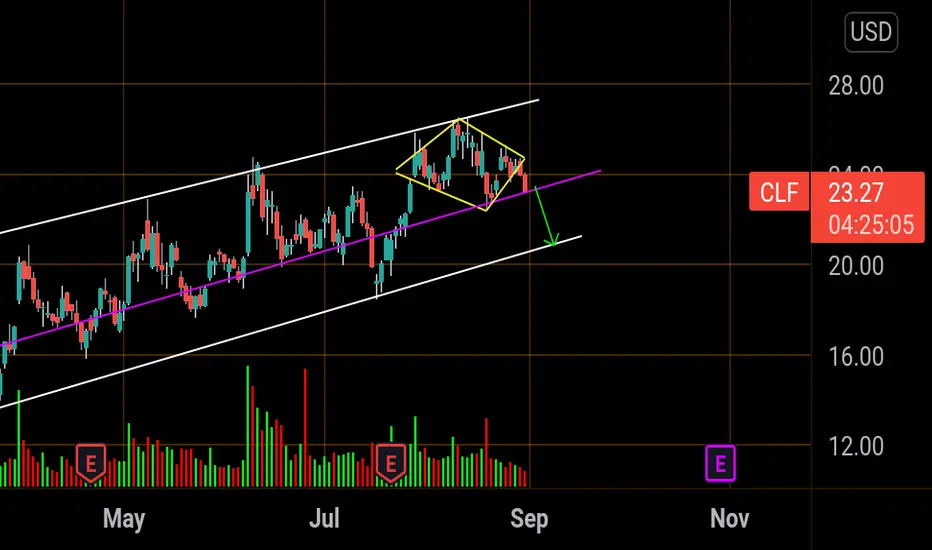
CLF.. bearish diamondWhite lines - Channel
Purple line - Split channel
Bear diamond - Yellow lines
Bear diamond spotted on CLF, Fell through support yesterday but i missed it. Target is channel bottom around 20$. Bounced off split channel today.. good entry below 23.20 -23.00
CLFHere’s another textbook channel play on the ticker $CLF. Currently, we’re at the very bottom of the channel, bouncing perfectly on our line and slightly consolidating. Previously, there was a break to the downside but we saw a rejection at the $19.76 line of support before returning to the ongoing pattern and continuing its momentum to the upside. We don’t see any green candles currently, so there’s a chance it can break and test the new line of support at $21.94. If it does break below $21.94, we’ll be looking for a short-term short position with a goal of the $19.76 line of support that had that rejection. If it breaks further than $19.76, we’ll be looking at a long-term short position of ~$15.06 or below. However, I’m feeling bullish and I’m expecting this to continue its trend in the channel to the upside with a goal of ~$27.44. The flow is looking massively bullish and the RSI is showing room for some more movements to the upside. I’d like to see a bullish engulfing candle sometime soon or a break of the $23.58 resistance level before entering into a long-term bullish position. If it does break, we’ll be holding our bags all the way up to the top.
CLF - Going upAccording to Traders-Paradise Algorithm, this has a high chance of going up as the TakeProfit & StopLoss strategy indicate.
For day traders - 11/8/21: High chance for going up today.

$CLF correction inevitable, still bullish long-termMacD and RSI on CLF calling for a selloff, I think we'll see it follow this ABC type correction pattern instead of a complete dump. If it tests white support line at point (C) I will be adding heavily to September calls. Currently in a short position. MacD is almost identical to every single prior selloff. Ultimately I am long this stock but the short term swing seems undeniable. Assuming ABC correction based on previous correction patterns and timeframes. Fib time zone placed between apex of bull trends.

Cleveland-CliffsVery difficult entry point, but excellent risk management. The stock is still in a long trend, so a trading idea is to retest either the trend line or the support level, which will give us confirmation at the beginning of a short trend and confirm a downward trend.
Let me remind you once again that these are just scripts. If it follows the script, then you can go. Deviations of the script are possible, but it is necessary to redo it competently.
Stop 0.5% Take 1 to 24.
If the scenario works out I will pull up the stop for each previous local maximum.
Don't forget to Like and write comments.

CLF Cycle CompletionI'm anticipating a dip at the bell Wednesday, followed by a climb to the 26.60 or possibly 27.60 area, completing the 4th channel cycle, before earnings.


CLF is clocklikeCLF is like a clock! Is there anything prettier than a stock that oscillates in channel? The peak-to-trough of this oscillation suggests that 5-6 dollar moves are possible. Cleveland Cliffs is an iron ore company that has been on a phenomenal run. There are incredible expectations for earnings as CLF quarterly revenue was up 1014.2%. This would be a unique play buying a call dated after earnings (7/23), but selling before the report. I am not a financial advisor. Play at your own risk.

$CLF | Double Bottom: Buy on Dips$CLF formed a double bottom and looks ready for continuation to the upside
Ideally we buy into a pullback so will be watching $21.60 down to $21 for entries

Triangle CLFTriangle. Honestly could go either way. I want to say LONG but not sure. Bought 15 calls though :)


CLF: Channel AlertCLF: Beta: 2.24, ATR: 1.17// Eyeing this channel for upside potential; Looking for confirmation build > 22.66. Channel applicable to downside price action.

CLF FLIGHT TO 130 - CRAMER TOP PICK ^^^ BULLISHThere's a stampede can you hear it!
US STEEL & IRON INDUSTRY IS STRONG SINCE CHINA OUTPUT HAS DECREASED
Cleveland-Cliffs Inc. NYSE Cleveland-Cliffs
NYSE:CLF
AMEX:SPY
SPCFD:SPX
TVC:SPX
NASDAQ:NDAQ
PLAY OF THE CENTURY 🚀

PT 26.80 for this cycle.NYSE:CLF
It is just a stopover on a long journey. Going to close my leveraged long position when price reaches 26.80, then wait for a pullback to buy again!
There is a significant open interest on options call 25 expiring at 2021-07-16, so I believe that the price should be at least 25 by that time.
I have noticed that NYSE:CLF is attracting the attention of WSB guys again, so we can expect another pump.
People may want to fix the profit before an earnings report.
Everything fits into price corridor

CLF target price 9$ + 43%Can't get any better than this If exceeds 200mA on a 15m bar today, will have a great rally.

Pullback Soon!Ending diagonals are my new favorite formation. Been seeing them in a lot of stock charts lately.
This one looks pretty clear. The wave 3 structure is gorgeous.
RSI broke down when we entered (iv) and we've been retesting the bottom ever since.
All these things are big indicators that a pullback will happen soon.
-40% seems like a lot, but that's what the chart says.

$CLF averaging up once again*This is not financial advice, so trade at your own risks*
*My team digs deep and finds stocks that are expected to perform well based off multiple confluences*
*Experienced traders understand the uphill battle in timing the market, so instead my team focuses mainly on risk management*
Recap: My teams original entry for $CLF is at $13. We averaged up on 5/23/21 at $18.06. On 6/10/21 we hit our take profit 1 at $24 per share and secured most of our profits.
My team averaged up once again on our remaining positions yesterday before the market closed at $20.60 per share. My team still plans to close this trade completely once our trade reaches our take profit 2.
Investors still looking for positions should be advised that $CLF may retest our red trendline before this occurs...but current shareholders have no reason to be concerned with this scenario for it will offer additional buying opportunities.
If you want to see more, please like and follow us @SimplyShowMeTheMoney

