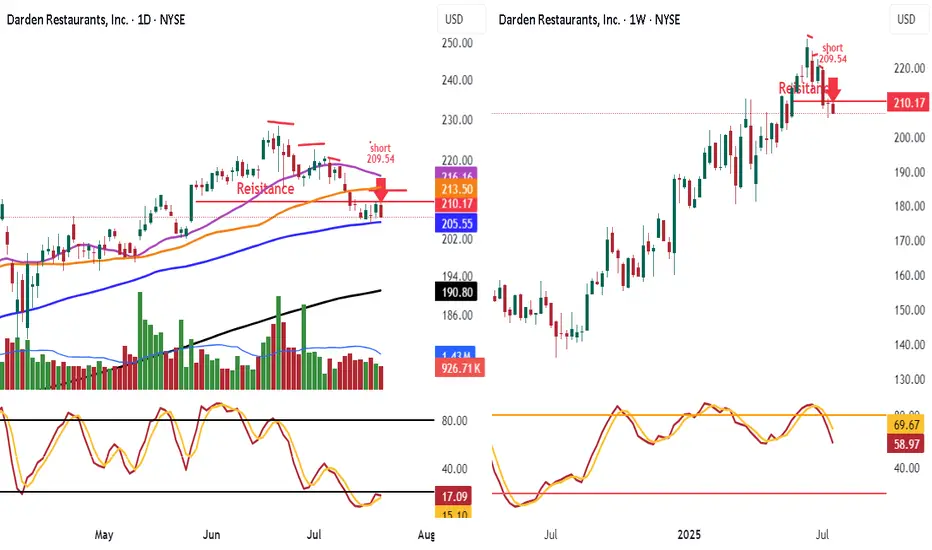
Shorted DRI 209.54 Look daily chart I shorted DRI going into resistance 210.17
look lower highs, Look all selling vol. Look at the 25 day ma rolling over heading to 50 day to cross thru, Look stoch heading down nice engulfing candle daily
Have order add breaks 100 day with vol 205.55
Look weekly stoch heading China weekly stoch triumphs over daily test book perfect short. Target 191 have trailing stop in place long term short why weekly stoch
0I77 trade ideas
Markets Running Out SteamWatch the vol as we head into resistance
XLF IWM are weak. Still in earnings season
have stops in place

Darden Restaurants (DRI): Restaurant Industry Momentum ContinuesDarden Restaurants, Inc. (DRI) is one of the largest full-service restaurant companies, operating well-known brands like Olive Garden, LongHorn Steakhouse, and The Capital Grille. With a focus on quality dining experiences, strong brand recognition, and strategic expansion, Darden continues to grow its market presence. Its success is driven by consistent customer demand, menu innovation, and operational efficiency, keeping it ahead in the competitive restaurant industry.
The stock chart recently showed a confirmation bar with increasing volume, moving into the momentum zone, which happens when the price moves above the 0.236 Fibonacci level. This signals strong investor confidence and potential for further gains as buyers step in.
Using a trailing stop is an effective way to manage risk and secure future exits. By setting a trailing stop, traders allow their positions to remain open while the stock trends higher, but they also lock in profits when momentum slows.

Darden May Have Broken OutDarden Restaurants jumped to new highs in December, and some traders may look for the move to continue this year.
The first pattern on today’s chart is the March 2024 high of $176.84. DRI remained below that level through early last month. The stock rallied through it after earnings and revenue beat estimates on December 19. Prices have remained above the old peak since, potentially confirming the breakout.
Second, the lower lows between March and July, followed by a series of higher lows, may be viewed as a rounded bottom.
Next, the 50-day simple moving average (SMA) crossed above the 100-day SMA in September and above the 200-day SMA in October. The 100-day surpassed the 200-day SMA in late November. (See the yellow arrows.) That arrangement, with faster SMAs above longer SMAs, may reflect a longer-term uptrend.
Finally, the 8-day exponential moving average (EMA) has remained above the 21-day EMA. That may reflect a shorter-term uptrend.
TradeStation has, for decades, advanced the trading industry, providing access to stocks, options and futures. If you're born to trade, we could be for you. See our Overview for more.
Past performance, whether actual or indicated by historical tests of strategies, is no guarantee of future performance or success. There is a possibility that you may sustain a loss equal to or greater than your entire investment regardless of which asset class you trade (equities, options or futures); therefore, you should not invest or risk money that you cannot afford to lose. Online trading is not suitable for all investors. View the document titled Characteristics and Risks of Standardized Options at www.TradeStation.com . Before trading any asset class, customers must read the relevant risk disclosure statements on www.TradeStation.com . System access and trade placement and execution may be delayed or fail due to market volatility and volume, quote delays, system and software errors, Internet traffic, outages and other factors.
Securities and futures trading is offered to self-directed customers by TradeStation Securities, Inc., a broker-dealer registered with the Securities and Exchange Commission and a futures commission merchant licensed with the Commodity Futures Trading Commission). TradeStation Securities is a member of the Financial Industry Regulatory Authority, the National Futures Association, and a number of exchanges.
TradeStation Securities, Inc. and TradeStation Technologies, Inc. are each wholly owned subsidiaries of TradeStation Group, Inc., both operating, and providing products and services, under the TradeStation brand and trademark. When applying for, or purchasing, accounts, subscriptions, products and services, it is important that you know which company you will be dealing with. Visit www.TradeStation.com for further important information explaining what this means.

Puts/Short setup on DRI (Darden Restaurants)NYSE:DRI gapped Up on Dec 19th. Fibonacci technical analysis: Now finding Resistance at Fib level –61.8% (188.82) on Upward Fib and Double Top formed. Price likely to retrace lower to retest the gap.
My Downward Fib shows retracement levels 38.2 % at 171, 61.8% at 166.5, and 78.6% at 164.
PUTS on NYSE:DRI with Target 1 at 178, Target 2 at 171, and Target 3 at 166.5
Stop Loss slightly above the –78.6% extension Fib level (199.25)

$DRI with a bullish outlook following its earnings #StocksThe PEAD projected a bullish outlook for NYSE:DRI after a positive over reaction following its earnings release placing the stock in drift B with an expected accuracy of 88.89%.

$DRI | Channel BreakoutJust some notes im sharing. I do not know this stock well, but so far it is respecting projections.
Ideally we need a pullback to enter long

$DRI Bullish Pennant??NYSE:DRI looks to be bouncing off support around $144 and the highs of $175. Currently, it is turning up below value at the current moment. Currently above the 200-EMA

Darden Faces Dining Divide: Lower-Income Consumers Pull Back Darden Restaurants ( NYSE:DRI ), the parent company of popular chains like Olive Garden and LongHorn Steakhouse, is experiencing a shift in consumer behavior that reflects broader economic trends. While lower-income customers are cutting back on dining out, wealthier diners are showing an increased appetite for restaurant meals.
CEO Rick Cardenas revealed that diners earning below $75,000, particularly those below $50,000, are noticeably reducing their visits across Darden's brands. This trend, attributed to an "ongoing" shift, is most evident in the company's fine-dining segment, marking a return to pre-pandemic consumer patterns.
However, there's a silver lining for Darden ( NYSE:DRI ) as affluent customers demonstrate a willingness to dine out more frequently. At LongHorn Steakhouse, for instance, higher-earning patrons are not only visiting more often but also spending more per visit. This disparity in consumer behavior underscores a widening dining divide influenced by income levels.
Despite facing headwinds in certain regions like Texas and California, Darden ( NYSE:DRI ) remains resilient. The company has adapted its strategy by scaling back on deep discounting and heavy promotions, instead focusing on marketing efforts and brand equity building. This shift signals a departure from pre-pandemic tactics and a commitment to long-term pricing strategies.
While same-restaurant sales experienced a slight decline across Darden's brands, Olive Garden and LongHorn Steakhouse still showcased resilience. Despite a drop in foot traffic, both brands saw an increase in average check size, indicating a balancing act between consumer spending habits and dining preferences.
Technical Outlook
The price of DRI shares has decreased $11.34 since the market last closed on Thursday, March 21. This is a 6.50% drop. but a Revival might be possible for NYSE:DRI which is up by 0.47% on Friday morning trading. NYSE:DRI has a Relative Strength Index (RSI) of 38 indicating selling pressure on the ticker.

Fast Food and Dining Stocks: Macro Fib SchematicsThese Fast Food Giants consist of McDonalds, Starbucks, YUM! Brands, Restaurant Brands Inc, Chipotle, Wendys, Darden Restaurants, Brinker International...
All Fibonacci Clusters are placed correctly. The 1 Month timeframe makes these charts realistic.

DRIDarden Restaurants is the premier full-service dining company, operating over 1800 locations.
Potential swing long.

Long on DardenNYSE:DRI
Retail spending is up, and you know what is anchored adjacent to retail spaces? Darden. Looks like a great price to get in, undervalued.

DRI Darden Restaurants Options Ahead of EarningsIf you haven`t sold DRI here:
Then analyzing the options chain and the chart patterns of DRI Darden Restaurants prior to the earnings report this week,
I would consider purchasing the 160usd strike price Calls with
an expiration date of 2024-1-19,
for a premium of approximately $4.10.
If these options prove to be profitable prior to the earnings release, I would sell at least half of them.
Looking forward to read your opinion about it.

$DRI forming a double topex div on 7th friday and the insiders also sold the shares its time for a down trend and looks like dri forming a double top if neckline break and confirm then 150 is target

DRI Darden Restaurants Options Ahead of EarningsAnalyzing the options chain of DRI Darden Restaurants prior to the earnings report this week,
I would consider purchasing the 160usd strike price Puts with
an expiration date of 2023-7-21,
for a premium of approximately $2.67.
If these options prove to be profitable prior to the earnings release, I would sell at least half of them.
Looking forward to read your opinion about it.

$DRI with a bullish outlook following its earnings #StocksThe PEAD projected a bullish outlook for $DRI after a positive under reaction following its earnings release placing the stock in drift A with an expected accuracy of 55.56%.

DARDEN RESTAURANTS short bearish trend to expect
Hi viewers, DRI price on zone, tech. side strong short bearish trend to expect
TP1:140
TP2:137

DRI Bullish Price tested the 50 SMA recently which also coincides with former resistance on the weekly at $144.
The recent close above the .78 Fibonacci level with eleveated volume is bullish, as is the cross of D+ over D- on the ADX which is also rising.
The MACD is setting up for a cross and the RSI is crossing its 14 day MA.
OBV confirms the trend.
Target: $157.46
Stop: $139.9 (just under support, approx 1.5x ATR)

$DRI with a Bullish outlook following its earnings #Stocks The PEAD projected a Bullish outlook for $DRI after a Negative over reaction following its earnings release placing the stock in drift C.

DRI High Pobability Buy SignalDear investors,
According To my analysis of Darden Restaurats, Inc Shares (DRI), there's a high probability of an increase next year toward the levels of 160.00$ that we have seen before in 2021.

$DRI with a Bearish outlook following its earnings #Stocks The PEAD projected a Bearish outlook for $DRI after a Negative Under reaction following its earnings release placing the stock in drift D with an expected accuracy of 82.86%.

Head and ShouldersH&S pattern and price is below the neckline.
A bullish AB=CD pattern seems to have helped DRI out as well as the 38% retracement of the impulse wave up.
Price is under the 50. The 20 appears to be acting as support recently.
No recommendation.
Short is around 4.25%

$DRI Chart Breaking DownWhale opened 500 JAN 100 puts and upon checking, noticed this chart looks pretty bearish IMO.
I'm swinging JUN 100 puts tight stop as I'm looking for a quick flush now that support has been breached. Any squeeze up is a better entry to short IMO, this chart is pretty ugly.
Gap Fill below is target in the short term at 103.16
