0I7E trade ideas
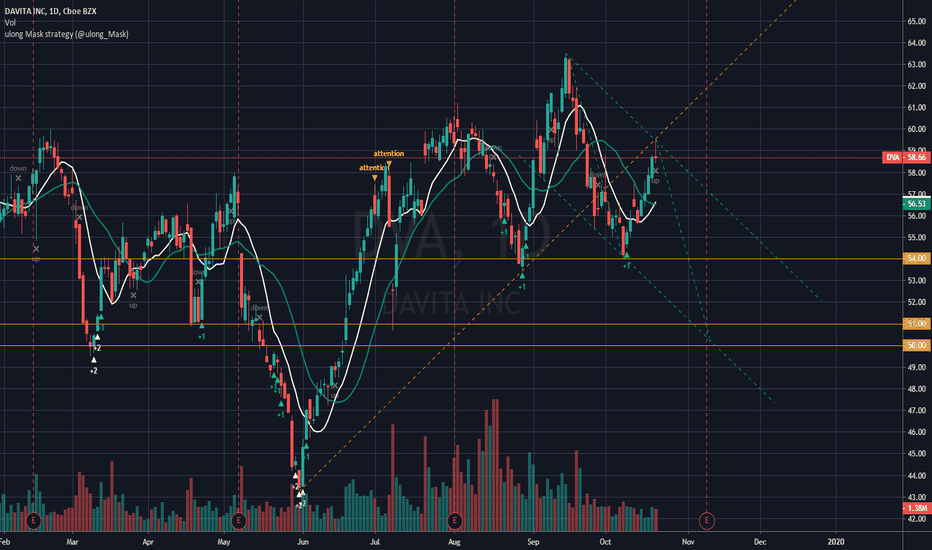
BUY to DAVITA INC DailyHey investors, DAVITA INC in a bullish push on a strong trend support with a large volume of buying executed and an attempt by repressed sellers. In this case we have a very strong sign of buying pressure, great possibility of breaking the fibonacci but with volume not force for a powerful break.
Please LIKE & FOLLOW, thank you!
Quick trade DVADaVita (DVA) might be considered for a quick trade. The earnings will be released on February 11, 2020, so there is not a lot of time left if you are going to take the trade. The fundamentals are fairly strong, so this may be one that you might want to keep in your arsenal. The stock gapped up on Friday showing that at least in the early morning of the market, the market makers did not have enough supply of stock in their inventory, so they had to gap up the prices. I would look at using a buy stop limit at $85.60. The stop should be about 7% below the price you paid. Happy trading! Bernard
Three Percent Trade Idea: Go Long DVAHere is a great opportunity to pick up DaVita .
At Three Percent Trades we have a price target of $70.00 / share, which is a potential upside of 19.5%.
We use a combination of fundamentals & technical analysis to trade high probability set-ups, and believe this is a great opportunity to take advantage.
Davita - now a BULL trend Technicals analysis WEEKLY
Davita broke a downtrend channel, and is now in a consolidation above the 200SMA. (Bull)
50SMA is now crossing above the 200SMA. (Bull)
OBV and RSI show divergence, as they have moved in oposite directions since early August. (Short). However... on a daily chart , we see a decent uptrend since early June.
Headlines / Fundamental
On July 10th:
President Donald Trump on Wednesday signed an executive order reimbursing for kidney transplants and reducing the reliance on the costly treatments at dialysis clinics.
Analyst fair value target price is $79. Meaning 38% undervalued .
A Good Swing Trade for DVAOn the weekly chart (below), we see that the price corrected to 61.8% Fibonacchi and tested support. It then continued up and broke through the 200 EMA line.
Moving down to the daily chart, we see a bullish divergence of the MACD histogram, and a break-though of the downward trend-line with high volume.
Our entry trigger will be at break of resistance above $68.90. A good swing trade with a risk : reward ration of 1:3.


