it's a low risk to temporarily park my money here.Equity Residential is focused on the acquisition, development and management of residential properties located in and around dynamic cities that attract affluent long-term renters.
Equity Residential owns or has investments in 312 properties consisting of 84,018 apartment units, with an established presence in Boston, New York, Washington, D.C., Seattle, San Francisco and Southern California, and an expanding presence in Denver, Atlanta, Dallas/Ft. Worth and Austin.
0IIB trade ideas

Avoid becoming a slumlord with $EQRKey Stats
Market Cap: $29.09B
P/E Ratio: 32.44
Dividend Yield: 3.5% ($0.675 quarterly, next dividend date: mid-December)
Projected 2025 Revenue Growth: +5% YoY
Technical Reasons EQR Will Go Up:
Channel Breakout: EQR is testing resistance around $77.50, with recent momentum suggesting a potential breakout into a bullish channel.
RSI Rebound: The RSI shows a strong bounce near the oversold territory, indicating growing buying pressure.
Institutional Buying Patterns: Volume surges last week hint at heavy accumulation, possibly from institutions positioning ahead of a sector-wide recovery.
Fundamental Reasons EQR Will Go Up:
Rent Demand Surge: Equity Residential specializes in urban, high-demand markets. Despite macro pressures, rents have remained stable, with 2024 projections showing steady demand in major metros.
Operational Efficiency: Recent cost-reduction initiatives are expected to boost net operating income, enhancing shareholder value.
REIT Sector Sentiment: Improving sentiment in REITs (Real Estate Investment Trusts) following the Fed’s dovish signals is driving inflows into this undervalued segment.
Potential Paths to Profit
Lowest Risk: Buy shares directly and hold. Reinvest dividends for compounded returns.
Options Play: Buy the June 2025 $80 calls. These are priced reasonably and align with the six-month time horizon.
Pairs Trade: Long EQR and short a weaker REIT peer for a market-neutral strategy.
Disclaimer: We are not a brokerage or investment firm. We do not offer financial advice or investment advice and/or signals. This is not certified financial education. We offer access to the daily thought process of an individual and his experiences. We do not offer refunds. All sales are final.

Equity Residential - Buy/LongThe Company is having better quarter YoY with EPS 40 cents up , Revenue up 28m , big company's from Finance sector have better quarter YoY too , expecting bullish move for the next 2 3 months in that sector.

EQUITY RESIDENTIAL
Hi viewers, EQR price on zone, in last periods bullish push we are have, currently here break expecting to see and new short bullish push
TP1:71.50
TP2:74

Earn 2 times the risk with this wedge patternOur algorithm shows EQR as an opportunity to buy at $63,57 aprox.
We've seen this pattern thousands of times before with a win ratio over 80%, considering the good risk reward of this trade seems reasonable to take it into consideration.
The take profits level could be before the 70’s area where the volume profile is also high again, which tend to be a problem for the trend continuation, at least for some days.
The idea is to earn almost a 10% in a few days risking half the profit. Due to high volume ahead and the bigger wedge, it’s better to take profits and go for the next pattern.

$EQR with a Bullish outlook following its earnings #Stocks The PEAD projected a Bullish outlook for $EQR after a Negative Under reaction following its earnings release placing the stock in drift D with an expected accuracy of 72.73%.

$EQR with a Bullish outlook following its earnings #Stocks The PEAD projected a Bullish outlook for $EQR after a Positive Under reaction following its earnings release placing the stock in drift A with an expected accuracy of 100%.

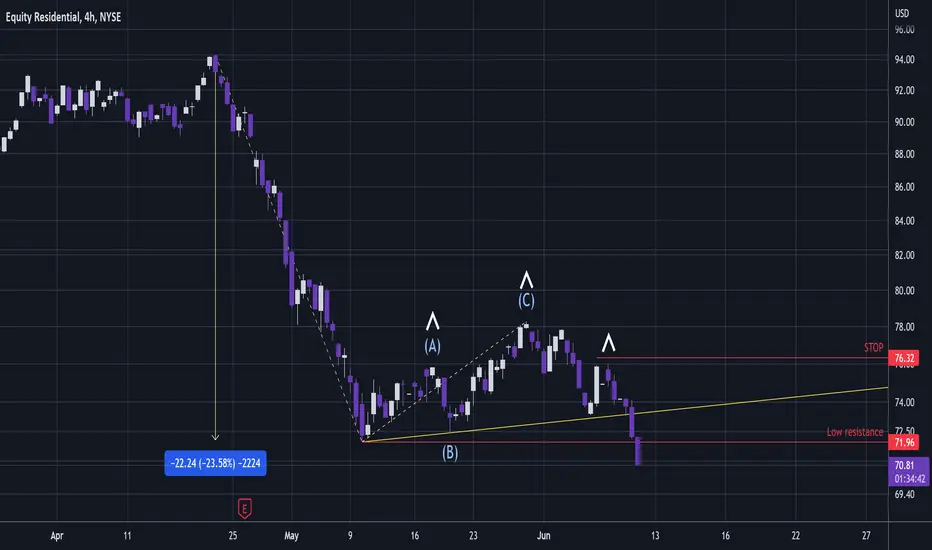
EQR - Continuation Pattern ShortEQR breaking down below trendline from probable 3 wave continuation pattern here and printed a H&S where right shoulder is probably a wave 2.
Previous collapse was a solid 23% collapse and if correct this should another collapse similar in ratio down to around $60.
Could re-test resistance low or perhaps the diagonal trendline.
Stop above right shoulder.
Not advice.
Equity Resenditials USASun Storm Investment Trading Desk & NexGen Wealth Management Service Present's: SSITD & NexGen Portfolio of the Week Series
Focus: Worldwide
By Sun Storm Investment Research & NexGen Wealth Management Service
A Profit & Solutions Strategy & Research
Trading | Investment | Stocks | ETF | Mutual Funds | Crypto | Bonds | Options | Dividend | Futures |
USA | Canada | UK | Germany | France | Italy | Rest of Europe | Mexico | India
Disclaimer: Sun Storm Investment and NexGen are not registered financial advisors, so please do your own research before trading & investing anything. This is information is for only research purposes not for actual trading & investing decision.
#debadipb #profitsolutions

Long Residential REITs through $EQRThis residential reit has a good divi and is at a solid level of support for an investment. it's gone sour lately cause it holds lots of places in big cities that people are moving from like LA NYC SF but i don't buy that shit those places will be overcrowded and have plenty of renters for decades to come

EQR BreakoutEQR getting closer to a breakout
2 Year Long Base
Wants to see a breakout and hold on weekly chart
Price above 200 DMA
Pays out Dividends

Equity Residential EQR - Short ZoneScaling into some shorts here. Risk to reward is exceptional here on a short.

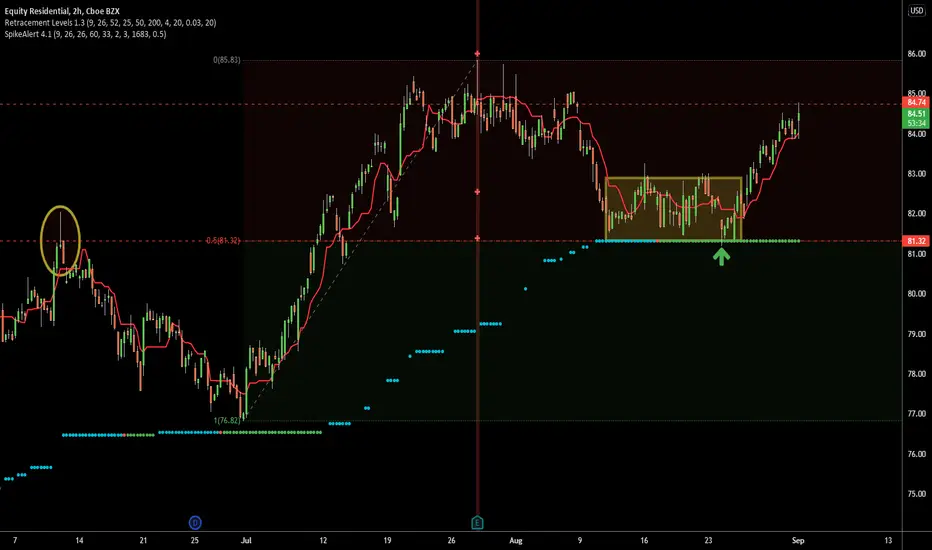
Textbook Retracement Level EQRThis is what I like to see: the stock NYSE:EQR pulled back to a 50% Retracement Level following an earnings high. This level matched with a past high price action and price hesitated for many weeks at the level before launching off it. The entry point was actually on a morning volatility spike 8/19/21 but this does not show properly on Tradingview data. Study this example.

Equity Residential Shares Fall 6.8% Below Previous 52-Week Low Equity Residential shares closed 6.8% lower than its previous 52 week low, giving the company a market cap of $19B. The stock is currently down 35.7% year-to-date, down 41.4% over the past 12 months, and down 20.0% over the past five years. This week, the Dow Jones Industrial Average rose 0.5%, and the S&P 500 rose 1.1%.
Trading Activity
Trading volume this week was 164.6% higher than the 20-day average.
Beta, a measure of the stock’s volatility relative to the overall market stands at 1.0.
Technical Indicators
The Relative Strength Index (RSI) on the stock was under 30, indicating it may be underbought.
MACD, a trend-following momentum indicator, indicates a downward trend.
The stock closed below its Bollinger band, indicating it may be oversold.
The stock closed at 7.0% lower than its 5-day moving average, 12.1% lower than its 20-day moving average, and 15.8% lower than its 90-day moving average.
Analyst Sentiment
Among analysts who cover the stock, there are currently 4 buy, 12 hold, and 5 sell recommendations
In aggregate, consensus analyst recommendation on the stock is an overweight
The current average analyst price target is $59.21 with a high of $77.00 and a low of $50.00
Market Comparative Performance
The company's share price beats the S&P 500 Index this week, lags it on a 1-year basis, and lags it on a 5-year basis
The company's share price beats the Dow Jones Industrial Average this week, lags it on a 1-year basis, and lags it on a 5-year basis
Peer Group Comparative Performance
The company's price-earnings ratio beats its average peer by 16.7%
The company's performance over the last 1 year beats its average peer by -15.4%
This story was produced by the Kwhen Automated News Generator. For more articles like this, please visit us at finance.kwhen.com. Write to editors@kwhen.com.

EQR - 4.37% Potential Profit - Descending TriangleDescending Triangle just broke out, aiming at ATL.
Lack of resistance confirmation means that we are chasing the price. However, my Stop/Loss is very tight and we are protected in case of an unexpected bounce. This is also due to the unpredictability of the market these days.
- Target Entry $51.92
- Target Stop Loss $52.48
- Target Exit $49.60
About me
- P/L September +33.74% | August: +232.32% | Historical Win Ratio 70.59% | No Trades without Analysis
- Note that I tend to adjust stop losses in order to secure profits early and preserve capital. This means that the target price is going to be achieved as long as there are no strong pullbacks that trigger my new adjusted stop loss

I Like The SetupThis looks like a good setup to me, and notice the volume spike at the end of the day.

EQR appraoching resistance, potential drop! EQR is appraoching our first resistance (horizontal overlap resistance, 76.4% fibonacci retracement) where a strong drop to our first support (50% fibonacci retracement) might occur.

EQR approaching resistance, potential drop! EQR is approaching our first resistance at 75.82 where we might see a corresponding drop in price to our first support at 69.68.
Stochastic is also approaching resistance where we might see a drop in price.

EQR approaching resistance, potential drop! EQR is approaching our first resistance at 75.82 (horizontal overlap resistance, 76.4% Fibonacci retracement) where a strong drop might occur below this level pushing price down to our major support at 69.68 (50% fibonacci retraecement).
Stochastic (55,5,3) is also approaching resistance where we might see a corresponding drop in price.

EQR Approaching Support, Potential Bounce!EQR is approaching our first support at 63.24 (horizontal swing low support, 61.8% fibonacci extenson, 50% fibonacci retracement) where a strong bounce might occur pushing price up to our major resistance at 68.16 (50% fiboancci retracement).
Stochastic (55,5,3) is also approaching our first support where we might see a corresponding bounce in price.


EQR - Very Good Time To Go Short/BearishElliot Impulse Bullish Wave 12345 just got completed. Earnings is scheduled for 4/24/18, so big events you need to worry about. Fib. Ret. price action just hit golden ration of 0.618, which high area for reversal time. I see at least a $5.00 bearish drop from $63 to $58 for next week or two. You could sell Bearish Put credit spreads and/or sell stock at this time. You get more leverage if you know how to use options in the right way. Good Luck!!
Nice two day Engulfing candlestick pattern on Thursday and Friday last week, at a resistance area too.
