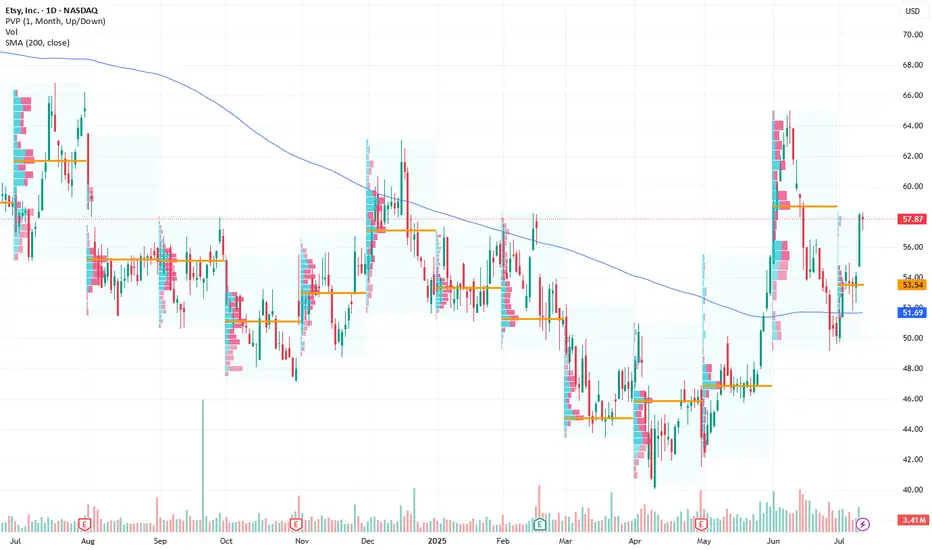
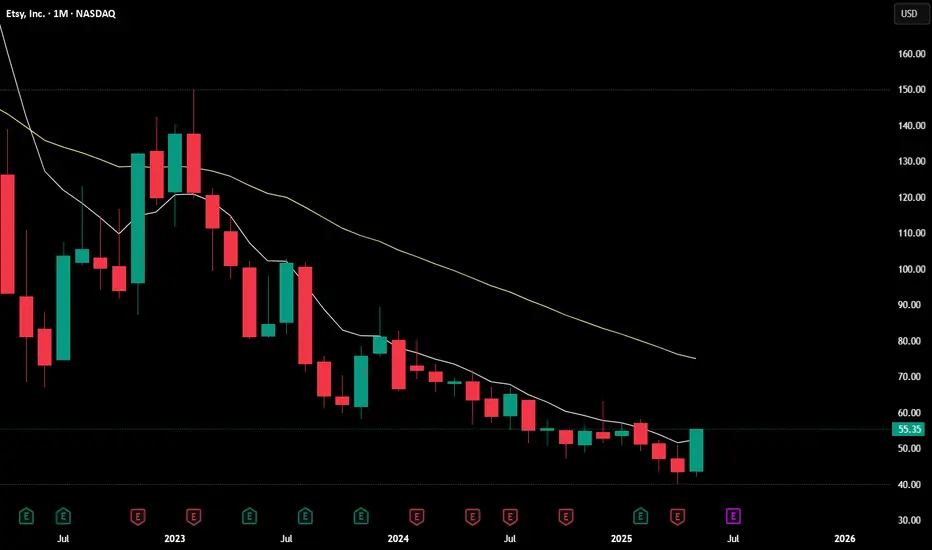
Etsy Positioned for a Strong Bullish Move Next WeekCurrent Price: $57.87
Direction: LONG
Targets:
- T1 = $60.50
- T2 = $64.00
Stop Levels:
- S1 = $56.00
- S2 = $54.50
**Wisdom of Professional Traders:**
This analysis synthesizes insights from thousands of professional traders and market experts, leveraging collective intelligence to identify
Key facts today
Next report date
—
Report period
—
EPS estimate
—
Revenue estimate
—
1.6 USD
303.28 M USD
2.81 B USD
102.87 M
About Etsy, Inc.
Sector
Industry
CEO
Joshua G. Silverman
Website
Headquarters
New York
Founded
2005
FIGI
BBG00JVRNKK2
Etsy, Inc. engages in the operation of an online marketplace. It offers handmade products such as shoes, clothing, bags, and accessories. It operates through the following segments: Etsy, Reverb, and Depop. The company was founded in 2005 and is headquartered in New York, NY.
Related stocks
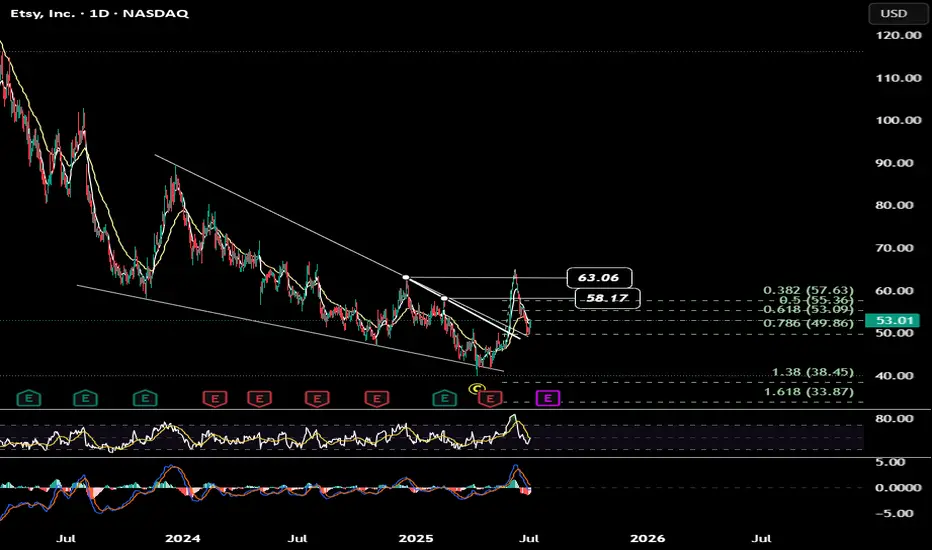
ETSY UPDATE ETSY is retesting ed trendline along with 78% fib . another chance or what !!!! same stop for me .
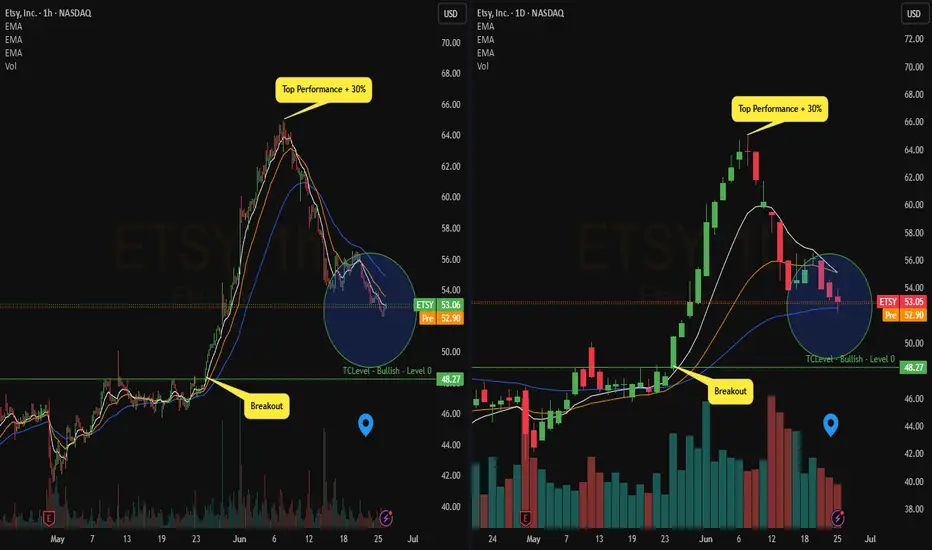
On Watch : $ETSY
- Bullish EMA on the daily with the 9 at the test of the 21
- Price at the test of the ema 50d
I expect a box here or we'll see the price at the test of the lower level
- The previous Break brought a performance of +30%
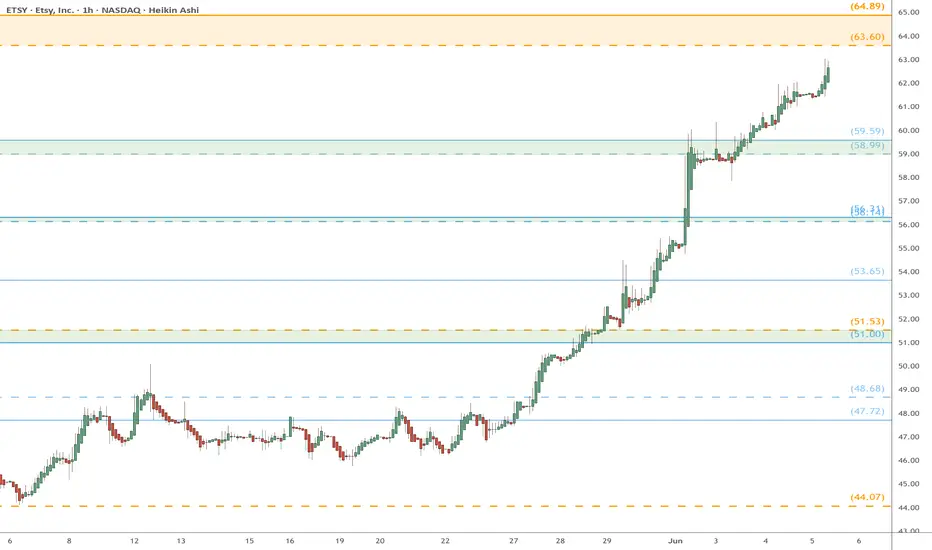
ETSY watch $64.xx: Double Golden zone to take some ProfitsETSY finally coming off its bottom and moving with gusto.
Approaching a Double-Golden fib zone at $63.60-64.89
Look for a Dip or Consolidation before uptrend resumes.
ETSY updatelong green candle + last 3 candles on the monthly time frame represents a Morning Star Candle Stick Pattern . i can tell that's Big . you can see my Elliot wave count on this one also.

ETSY eyes on $44.07: Golden fib could End Bounce or mark BOTTOM ETSY struggling against a Golden Covid fib at $44.07
Below is an even stronger Golden Genesis fib at $42.41
Those fibs define the current range that we look to break.

$ETSY hitting buy zonesLooking for a continuing downside on NASDAQ:ETSY to the $41-$42 area. Would look to add calls around there to a bounce of $45-$50.
WSL

ETSY at a ForkComing to the point of the declining triangle, either will break out, target $55, the T2 $57
or break down, support target $50, then $47.
Leaning bullish and expecting it to break out in my subjective opinion.
Looking for a Long Entry of $52.00

ETSY Santa Run? ETSY looks set for a run heading into the holiday season, like it's done the last few years. Here's why I like ETSY long, at least in the short-term heading into the New Year:
- Falling wedge breakout on the daily chart
- Rising volume on breakout moves
- Healthy consolidation above breakout
- Con

See all ideas
Summarizing what the indicators are suggesting.
Neutral
SellBuy
Strong sellStrong buy
Strong sellSellNeutralBuyStrong buy
Neutral
SellBuy
Strong sellStrong buy
Strong sellSellNeutralBuyStrong buy
Neutral
SellBuy
Strong sellStrong buy
Strong sellSellNeutralBuyStrong buy
An aggregate view of professional's ratings.
Neutral
SellBuy
Strong sellStrong buy
Strong sellSellNeutralBuyStrong buy
Neutral
SellBuy
Strong sellStrong buy
Strong sellSellNeutralBuyStrong buy
Neutral
SellBuy
Strong sellStrong buy
Strong sellSellNeutralBuyStrong buy
Displays a symbol's price movements over previous years to identify recurring trends.
ETSY5434196
Etsy, Inc. 0.25% 15-JUN-2028Yield to maturity
5.48%
Maturity date
Jun 15, 2028
ETSY5253820
Etsy, Inc. 0.125% 01-SEP-2027Yield to maturity
5.33%
Maturity date
Sep 1, 2027
US29786AAP1
ETSY 25/30 CV 144AYield to maturity
0.57%
Maturity date
Jun 15, 2030
ETSY5056972
Etsy, Inc. 0.125% 01-OCT-2026Yield to maturity
0.55%
Maturity date
Oct 1, 2026
See all 0IIW bonds
Curated watchlists where 0IIW is featured.


Frequently Asked Questions
The current price of 0IIW is 63.0 USD — it has increased by 2.38% in the past 24 hours. Watch ETSY INC USD0.001 stock price performance more closely on the chart.
Depending on the exchange, the stock ticker may vary. For instance, on LSE exchange ETSY INC USD0.001 stocks are traded under the ticker 0IIW.
0IIW stock has risen by 4.58% compared to the previous week, the month change is a 8.21% rise, over the last year ETSY INC USD0.001 has showed a 1.45% increase.
We've gathered analysts' opinions on ETSY INC USD0.001 future price: according to them, 0IIW price has a max estimate of 70.00 USD and a min estimate of 31.00 USD. Watch 0IIW chart and read a more detailed ETSY INC USD0.001 stock forecast: see what analysts think of ETSY INC USD0.001 and suggest that you do with its stocks.
0IIW reached its all-time high on Nov 26, 2021 with the price of 306.8 USD, and its all-time low was 17.8 USD and was reached on Feb 9, 2018. View more price dynamics on 0IIW chart.
See other stocks reaching their highest and lowest prices.
See other stocks reaching their highest and lowest prices.
0IIW stock is 4.68% volatile and has beta coefficient of 0.55. Track ETSY INC USD0.001 stock price on the chart and check out the list of the most volatile stocks — is ETSY INC USD0.001 there?
Today ETSY INC USD0.001 has the market capitalization of 6.30 B, it has increased by 0.17% over the last week.
Yes, you can track ETSY INC USD0.001 financials in yearly and quarterly reports right on TradingView.
ETSY INC USD0.001 is going to release the next earnings report on Jul 30, 2025. Keep track of upcoming events with our Earnings Calendar.
0IIW earnings for the last quarter are −0.49 USD per share, whereas the estimation was 0.47 USD resulting in a −204.48% surprise. The estimated earnings for the next quarter are 0.48 USD per share. See more details about ETSY INC USD0.001 earnings.
ETSY INC USD0.001 revenue for the last quarter amounts to 651.18 M USD, despite the estimated figure of 641.58 M USD. In the next quarter, revenue is expected to reach 647.51 M USD.
0IIW net income for the last quarter is −52.10 M USD, while the quarter before that showed 129.91 M USD of net income which accounts for −140.10% change. Track more ETSY INC USD0.001 financial stats to get the full picture.
No, 0IIW doesn't pay any dividends to its shareholders. But don't worry, we've prepared a list of high-dividend stocks for you.
As of Jul 22, 2025, the company has 2.42 K employees. See our rating of the largest employees — is ETSY INC USD0.001 on this list?
EBITDA measures a company's operating performance, its growth signifies an improvement in the efficiency of a company. ETSY INC USD0.001 EBITDA is 527.01 M USD, and current EBITDA margin is 18.39%. See more stats in ETSY INC USD0.001 financial statements.
Like other stocks, 0IIW shares are traded on stock exchanges, e.g. Nasdaq, Nyse, Euronext, and the easiest way to buy them is through an online stock broker. To do this, you need to open an account and follow a broker's procedures, then start trading. You can trade ETSY INC USD0.001 stock right from TradingView charts — choose your broker and connect to your account.
Investing in stocks requires a comprehensive research: you should carefully study all the available data, e.g. company's financials, related news, and its technical analysis. So ETSY INC USD0.001 technincal analysis shows the strong buy rating today, and its 1 week rating is buy. Since market conditions are prone to changes, it's worth looking a bit further into the future — according to the 1 month rating ETSY INC USD0.001 stock shows the neutral signal. See more of ETSY INC USD0.001 technicals for a more comprehensive analysis.
If you're still not sure, try looking for inspiration in our curated watchlists.
If you're still not sure, try looking for inspiration in our curated watchlists.