FIVE eyes on $63.00: Golden Genesis fib for 8% bounceFIVE trying to launch off Golden Genesis fib at $63.00
Target for bounce would be double fib at $68.46/54
Stop Loss just below Golden for high Risk -:- Reward.
0IPD trade ideas

FIVE Five Below Options Ahead of EarningsIf you haven`t bought FIVE before the previous earnings:
Now analyzing the options chain and the chart patterns of FIVE Five Below prior to the earnings report this week,
I would consider purchasing the 115usd strike price Puts with
an expiration date of 2025-6-20,
for a premium of approximately $4.35.
If these options prove to be profitable prior to the earnings release, I would sell at least half of them.

Clean break to upper 80s with the catalyst + TABased on numerous ideas indicating a breakout from the current downtrend, one as close to rising is oscillators midway towards their range. It is sitting on resistance, but too many things are going against a continuing pattern (not to say it can't happen) and staying within the current scope of things, but not likely, IMHO.

Five Below, Inc. (NASDAQ: FIVE) Surge 10% In Premarket Trading Five Below, Inc. (NASDAQ: NASDAQ:FIVE ) a company that operates as a specialty value retailer in the United States today announced financial results for the fourth quarter and full year of fiscal 2024 ended February 1, 2025.
The fourth quarter and full year of fiscal 2023 ended February 3, 2024 contained one additional week ("53rd week"), which represented $48.1 million in net sales and approximately $0.15 in diluted earnings per share.
Prior the earnings report, shares of Five Below, Inc. (NASDAQ: NASDAQ:FIVE ) surged 10% in Thursday's Premarket trading bouncing from the psychological support point of $70 and a breakout above the $80 zone could spark a move to the resistant zone that aligns with the 1-month pivot.
For the fourth quarter ended February 1, 2025:
Net sales increased by 4.0% to $1.39 billion from $1.34 billion in the fourth quarter of fiscal 2023 or an increase of 7.8% when excluding the impact of the 53rd week in fiscal 2023; comparable sales decreased by 3.0%.
The Company opened 22 net new stores and ended the quarter with 1,771 stores in 44 states. This represents an increase in stores of 14.7% from the end of the fourth quarter of fiscal 2023.
Operating income was $246.8 million compared to $268.4 million in the fourth quarter of fiscal 2023. Adjusted operating income was $253.3 million or a decrease of 1.5% when excluding the impact of the 53rd week in fiscal 2023.
The effective tax rate was 25.2% compared to 25.8% in the fourth quarter of fiscal 2023.
Net income was $187.5 million compared to $202.2 million in the fourth quarter of fiscal 2023. Adjusted net income was $192.4 million or a decrease of 0.7% when excluding the impact of the 53rd week in fiscal 2023.
Diluted income per common share was $3.39 compared to $3.65 in the fourth quarter of fiscal 2023. Adjusted diluted income per common share was $3.48 or a decrease of 0.6% when excluding the impact of the 53rd week in fiscal 2023.
Ken Bull, COO, said “We were pleased to end the year with fourth quarter sales and EPS above our outlook. We entered the holiday period with the goal of showcasing more newness with key trend-right, value product, while also improving our operational execution and in-store experience. We were very encouraged to see early positive results from our teams’ efforts and are excited to build on this in 2025 with Winnie at the helm.”
Analyst Forecast
According to 21 analysts, the average rating for FIVE stock is "Buy." The 12-month stock price forecast is $121.74, which is an increase of 61.05% from the latest price.

FIVE BELOW Stock Chart Fibonacci Analysis 011125Trading Idea
1) Find a FIBO slingshot
2) Check FIBO 61.80% level
3) Entry Point > 100/61.80%
Chart time frame: B
A) 15 min(1W-3M)
B) 1 hr(3M-6M)
C) 4 hr(6M-1year)
D) 1 day(1-3years)
Stock progress: A
A) Keep rising over 61.80% resistance
B) 61.80% resistance
C) 61.80% support
D) Hit the bottom
E) Hit the top
Stocks rise as they rise from support and fall from resistance. Our goal is to find a low support point and enter. It can be referred to as buying at the pullback point. The pullback point can be found with a Fibonacci extension of 61.80%. This is a step to find entry level. 1) Find a triangle (Fibonacci Speed Fan Line) that connects the high (resistance) and low (support) points of the stock in progress, where it is continuously expressed as a Slingshot, 2) and create a Fibonacci extension level for the first rising wave from the start point of slingshot pattern.
When the current price goes over 61.80% level , that can be a good entry point, especially if the SMA 100 and 200 curves are gathered together at 61.80%, it is a very good entry point.
As a great help, tradingview provides these Fibonacci speed fan lines and extension levels with ease. So if you use the Fibonacci fan line, the extension level, and the SMA 100/200 curve well, you can find an entry point for the stock market. At least you have to enter at this low point to avoid trading failure, and if you are skilled at entering this low point, with fibonacci6180 technique, your reading skill to chart will be greatly improved.
If you want to do day trading, please set the time frame to 5 minutes or 15 minutes, and you will see many of the low point of rising stocks.
If want to prefer long term range trading, you can set the time frame to 1 hr or 1 day.

FIVE Five Below Options Ahead of EarningsAnalyzing the options chain and the chart patterns of FIVE Five Below prior to the earnings report this week,
I would consider purchasing the 100usd strike price Calls with
an expiration date of 2024-12-20,
for a premium of approximately $5.00.
If these options prove to be profitable prior to the earnings release, I would sell at least half of them.

FIVE ShortSeller popped up getting in early increases R:R but drops probability. Open small position and add if the price drops
Pivot 76.96

Five LongLongterm buy here. Buyers on monthly Time Frame can cause massive moves as seen before. R:R really good here.
Pivot 72.79

$FIVE - back to $60 - call it a low fiveFibs show a lot of room to fall, key support is broken have to move chart to weekly just to find support and it's $60ish. Look at that regression channel! Holy snapped in half batman. It is forming an all new regression that can't even be mapped yet....
I don't even know what this company does but did they steal facebook's logo? wut lol
I mean look at the chart. Wish i saw this earlier. Put volume shows puts to $60 it's no accident on this one either.
biden has covid - so the market is crashing?
Wht a weird world we live in.
To $60 we go
not trade advice

FIVE Bat and Butterfly Harmonic Long on the DailyBat and Butterfly Harmonic Long on the Daily.
Entry at $72.60, Stop Loss $61.86 (-12%).
Target 1 4.7 to 1 Risk to Reward.
Target 2 8.6 to 1
Target 3 16.6 to 1

FIVE is approaching very strong supportFIVE is nearing a strong support area on the weekly chart. I entered a position today for half size and will buy the other half at $106.21.

FIVEFive Below Inc. is an American chain of specialty discount stores that prices most of its products at $5 or less, plus a smaller assortment of products priced up to $25. Founded by Tom Vellios and David Schlessinger and headquartered in Philadelphia, Pennsylvania, the chain is aimed at tweens and teens.
Potential swing long/re-entry.

Hi Five next week or summer?I have not charted Five in a very long time. I could be rich!!! Weekly candle strong close. Break and hold above 205... 210/215/220 targets. Earnings 8/31. Could se clear 220 before then? I'm watching. Have a great weeked.

FIVE trading above key resistanceFive Below Inc. (FIVE) presently trading above key resistance.
A weekly settlement above this area would result in a buy signal where gains of 20% would be expected over the following 5 - 6 months.
Inversely, failing to close above this resistance level on a weekly basis would allow (FIVE) to fall back to near-term support, signaling losses of 15% over the following 2 - 3 months.

FIVE BELOW OR NOOOO?five below has resistance at 179.80 on the daily if we break and retest and use as support i am looking for calls stop loss 179.50 exit at mid 180s if we do not break above I’ll expect a pull back to lower 170s ascending triangle on weekly

FIVE Below Options Ahead of EarningsAnalyzing the options chain and the chart patterns of BMO Bank of Montreal prior to the earnings report this week,
I would consider purchasing the 185usd strike price Calls with
an expiration date of 2024-1-19,
for a premium of approximately $15.95.
If these options prove to be profitable prior to the earnings release, I would sell at least half of them.
Looking forward to read your opinion about it.

This is Ugly for 5BelowI'm probably underestimating coming drop, but at minimum:
Initial Target 160 by 6/16
Target 144 by end of July
I think it could see double digits by end of 2023

All set to collapse?They rally might have ended and it could go sideways and eventually collapse onto that green line. I would NOT be buying it here.

FIVE 3/20/20235 below? More like 6 below!
FIVE Daily chart analysis.
Five started its Uptrend in September 2017.
Covid came and snapped the uptrend in February 2020 but by August 2020 price snapped back up and continued its uptrend. The momentary fall in price during covid proved to be nothing but a false breakdown.
The Uptrend continue until January 2022 where it fell back to post covid levels.
Since then, price attempted to make high highs but failed. It is now moving sideways with no trend in what looks to be a possible distribution stage.
Companies continue to shred all the covid gains made from all the fake money that was printed. FIVE will also follow suit.
Entering trade short
Target 1-
Entry: 196.55
Stop loss: 222.71, (-13.31%)
Target: 113.00, +42.51%, 3.19 RR ratio
Target 2-
Entry: 196.55
Stop loss: 222.71, (-13.31%)
Target: 52.67, +73.20%, 5.5 RR ratio

High FIVE to FIVE for showing upside to come to $238.28Cup and Handle has formed since 2022 which broke above recently.
The price has come back down in the handle but it seems like the price wants to retest the uptrend.
7>21 (Bullish)
Price >200 (Bullish + Green back)
RSI >50 (Bullish - Green back)
Target $238.28
CONCERN:
We are seeing the price come down below the Handle. This isn't ideal after a breakout above the brim level as investors start getting spooked out of their trades.
I would consider this a medium probability trade and we should let the price come back a bit.

Five Below, Inc. Expands and Declassifies its Board of DirectorsFIVE: Five Below, Inc
2022-06-04 16:01:00
Five Below, Inc. Expands and Declassifies its Board of Directors, Announces Share Repurchase Program

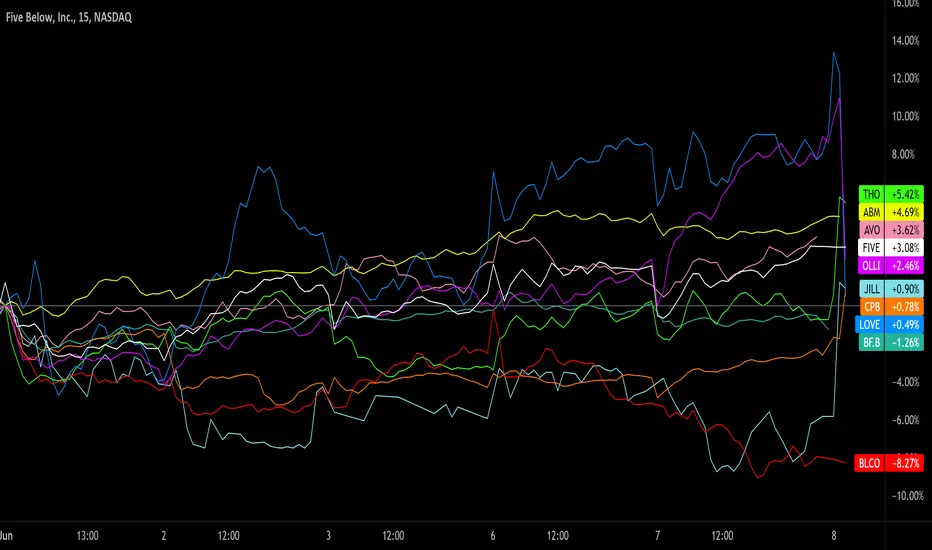
Earnings watch 6/8Earnings watch 6/8:
FIVE
THO
ABM
AVO
OLLI
JILL
CPB
LOVE
BF.B
BLCO
Do your own due diligence, your risk is 100% your responsibility. This is for educational and entertainment purposes only. You win some or you learn some. Consider being charitable with some of your profit to help humankind. Good luck and happy trading friends...
*3x lucky 7s of trading*
7pt Trading compass:
Price action, entry/exit
Volume average/direction
Trend, patterns, momentum
Newsworthy current events
Revenue
Earnings
Balance sheet
7 Common mistakes:
+5% portfolio trades, capital risk management
Beware of analyst's motives
Emotions & Opinions
FOMO : bad timing, the market is ruthless, be shrewd
Lack of planning & discipline
Forgetting restraint
Obdurate repetitive errors, no adaptation
7 Important tools:
Trading View app!, Brokerage UI
Accurate indicators & settings
Wide screen monitor/s
Trading log (pencil & graph paper)
Big, organized desk
Reading books, playing chess
Sorted watch-list
Checkout my indicators:
Fibonacci VIP - volume
Fibonacci MA7 - price
pi RSI - trend momentum
TTC - trend channel
AlertiT - notification
tickerTracker - MFI Oscillator
www.tradingview.com
Five Below - Entry Above Trend LinePrice has dipped again to the Green MA line
This dip has a strong resistance in red
Enter once price has crossed over the red trend line, as seen in the first climb over
