Watchlist 2023-02-01 #AMD #EA #BIDU #HLIT #MTCHSPY had an impressive hold of the 400 level PD, making sure to fake out any early longs in the morning, allowing it to grind higher for the rest of the day. The focus today in FED decision. The fed funds tool is pointing to a 99% chance of a 0.25 point hike coming from the Fed so most attention will be on the comments from Fed Chair Powell on any indication of further slowing on hikes from the Federal Reserve.
EA - down 5.6 ATRs in the PM. Statistics show that stocks gapping down more than 4 ATRs with a RVOL of <2. 40% finish the day green. Looking for price to test and fail under 116.25 on vol to consider a long. No short IMO.
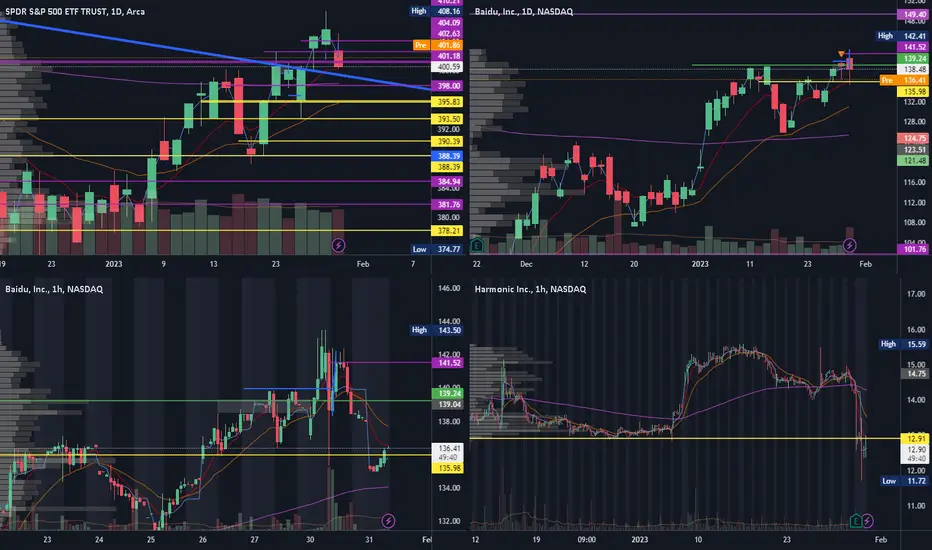
BIDU - still on radar. Looking for support to form between 141.50 and 139. 24
HLIT - capitulation at 12.91 yesterday at the close. IMO sellers are out now if we stay above key level. Buying dips off 13.00
AMD - great earning beat, expects earnings to improve in second quarter. Pivot and 200 MA resistance at 79.00. No longs unless the is a flush out with tight R/R
Other short watches, MTCH, AMGN
0J38 trade ideas

Watchlist 2023-01-31 #BIDU #HLIT #SOFISPY failed at the 404 level yesterday and continued to grind lower, but without a spike in VIX. Still making higher highs and lows so the overall strength is still present, we are just looking for support on the daily. Next key weekly level is 398, then 395.80 - a weekly support and a high vol node.
BIDU - new regarding chatbot was sold early on, recovered fully, then continued to fade late in the session. Bit of a mixed bag. Only looking long if support confirms at 136.
HLIT - beat on rev and earnings but guided lower than expectations. Now, gapping down 2.8 ATRs into very key support area. There is room in either direction off support so looking for capitulation below for a long above 12.90 or weakness below for a short.
SOFI - Relative volume of 4.7 prior day. If it forms clear resistance at 6.70 (200 MA) then breaks and holds about, there is room to make a new HOD. This might be a better play tomorrow if we get and inside day. But due to yesterday's vol that seems unlikely. If SOFI can hold 6.35 (PD low and key Pivot) we can risk off there as well.
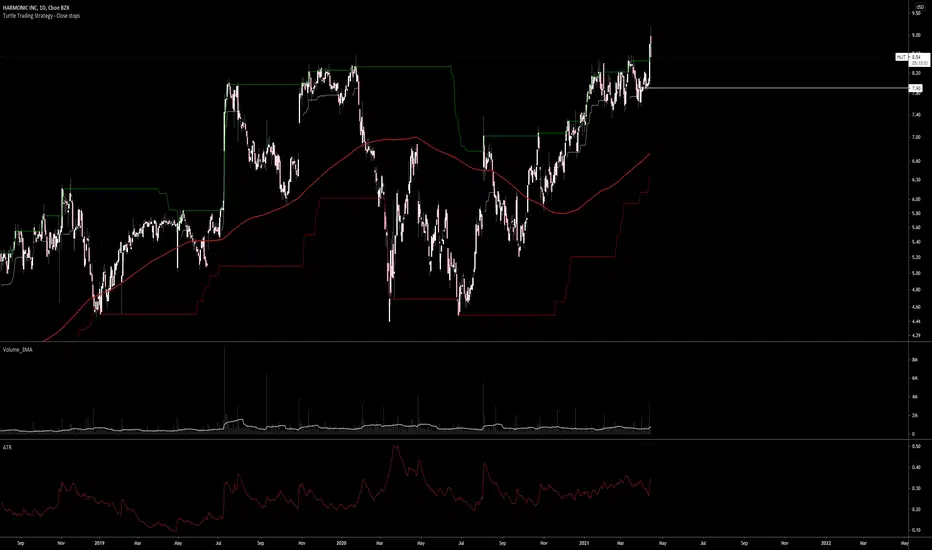
Harmonic Holds the 50-dayIt’s often interesting to find stocks making new highs when the market tanks. Today’s chart focuses on such a name: Harmonic.
Notice how the provider of video software advanced in late September and early October as the S&P 500 and Nasdaq-100 hit new 52-week lows.
That relative strength followed an Analyst Day on September 15. Heavy volume occurred as prices rose the next session, a potential sign of new buying after the event.
HLIT then rallied about 40 percent. It reported better-than-expected quarterly numbers on October 31, but traders “sold the news.” The shares proceeded to form an A-B-C correction but are trying to bounce at their 50-day simple moving average (SMA).
Next, the pullback held a 50 percent retracement of the preceding rally.
Finally, stochastics are trying to rebound from an oversold condition.
TradeStation has, for decades, advanced the trading industry, providing access to stocks, options, futures and cryptocurrencies. See our Overview for more.
Important Information
TradeStation Securities, Inc., TradeStation Crypto, Inc., and TradeStation Technologies, Inc. are each wholly owned subsidiaries of TradeStation Group, Inc., all operating, and providing products and services, under the TradeStation brand and trademark. You Can Trade, Inc. is also a wholly owned subsidiary of TradeStation Group, Inc., operating under its own brand and trademarks. TradeStation Crypto, Inc. offers to self-directed investors and traders cryptocurrency brokerage services. It is neither licensed with the SEC or the CFTC nor is it a Member of NFA. When applying for, or purchasing, accounts, subscriptions, products, and services, it is important that you know which company you will be dealing with. Please click here for further important information explaining what this means.
This content is for informational and educational purposes only. This is not a recommendation regarding any investment or investment strategy. Any opinions expressed herein are those of the author and do not represent the views or opinions of TradeStation or any of its affiliates.
Investing involves risks. Past performance, whether actual or indicated by historical tests of strategies, is no guarantee of future performance or success. There is a possibility that you may sustain a loss equal to or greater than your entire investment regardless of which asset class you trade (equities, options, futures, or digital assets); therefore, you should not invest or risk money that you cannot afford to lose. Before trading any asset class, first read the relevant risk disclosure statements on the Important Documents page, found here: www.tradestation.com .

Cup and handleCup & handle that’s been formed since January. After an insider sell (sept 16) the price dropped a bit, but then after, an increase in volume, and it then broke the resistance line

HLIT - Cup with HandleEarly buy within base after seeing a Pocket Pivot develop yesterday crossing both the 10/20 EMA. Stop loss using yesterday's low

HLIT Very BullishIn recent days HLIT has consolidated at the 50 MA which appears to act as support as it coincides with prior resistance from the July high and the high open in April. This point of consolidation also acts as a gap fill from the gap up in August.
Given the confluence of all these points and that HLIT closed above the 1 Fib level ($9.17), a MACD curling up and an RSI of 49 I believe HLIT is ready for the next leg up.
Target $10.68 in the short term.

Long-term Downtrend Broken?Time will tell but it appears an almost 20-year downtrend/basing period has been broken. The breakout occurred with significant volume which makes it more likely to be genuine. Of course an initial shakeout/head fake could follow (and I may not have the trend line exactly right, tried to place it where there were the most hits, but a few times that resulted in false breakouts in the past). Anyway, long-term I like this stock. Fundamentally, can the company finally turn from years of losing money to profitability? Analysts estimate a profitable next quarter for the company. Will that happen? And can that profitability be maintained long-term? Those are the big fundamental questions for this stock.
Just some pretty simple observations, not advice, trade at your own risk.

Harmonic Inc on the weekly looking very interestingYou can draw your "yellow" B wave as a WXY, trendfib it, and you double bottomed at equal length. You can count 7 swings. When you examine the trend line touches of structure, it can count complete. If you invested lower down, I would say it would be worthy the gamble of letting run. Notice the "0" level lower down. The stock has been working on this pattern a long time. Check your fundamentals, but pay attention for at least a buy setup to 800 ma on weekly.

HLIT - My new end of May play.I'll be updating this post with more indicators as to why I'm bullish on Harmonics from a technical standpoint (MACD, EMA, Fib Retracement, Volume, etc...)
But on this first chart we see we not only have a very strong MACD but we also have huge upside on the Fib Retracement. When I look to pick my new plays I typically look for EMA 50 crossing above the EMA 9 and with an RSI below 60 (not overbought)
I'll keep updating the various indicators and include the sell strategy I hope to implement in my free time this weekend.
Have fun trading and look both ways before crossing the street
*Delgado*

watching hlitJust keeping an eye on hlit ascending flag breakout looks like it may want to breakout above $4 soon


