SILVER will follow GOLD?SLV: SILVER will follow GOLD?
-Breakout of long time accumulation.
-Vol for demand confirmed.
-Inversed HnS pattern.
-Demand zone waiting for a pull back.
.
Wait n see!
0JKC trade ideas

Silver Squeeze Meme AGAIN? Do not get tricked!AMEX:SLV It's that time again! #silversqueeze is trending on social media. This meme resurfaces every 2-3 years CONSISTENTLY when whomever thinks the time is right to take retail traders' money. With Gold AMEX:GLD making new highs they are trying it once again.
Watch my video from 2021 and do the research on Google News yourself! Wait for the price action confirmation that I talk about in this video! Do not get tricked!
COMEX:SI1! COMEX:GC1!

SLV to dump???I sold today. I believe this is about to get a beat down.
I did not and won't be selling my physical.
Down to $12 and up to $48???
NOT FINANCIAL ADVICE!!!

Silver bullish break out, mid 30s target, 50-60 potentialIts taken a long time, but silver has finally shown life toward the upside.
Bullish moves in silver have taken 8-10 years in the past to fully play out.
If 2020 marks the beginning of the bullish move, then this move could last until 2030.
Bullish head and shoulders pattern could target silver to the mid 30s level.
If silver shows continued strength, then the 50 level will be a simple target for investors to eye and aim at.
Macro news is the concerns of geo politics and delayed rate cuts due to higher inflationary costs. Flight to safety is good for precious metals and inflation concerns make metals attractive as a inflation hedge.

$SLV Just getting started! Confirmed weekly breakout incoming. Silver has broken a major trendline on high volume and looks to go higher.

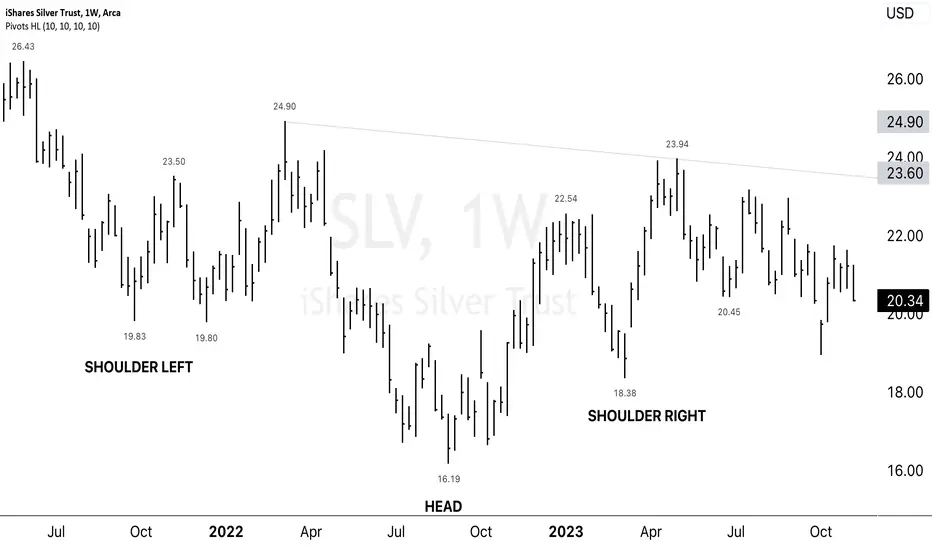
$SLV Silver Inverse Head & Shoulders Weekly ChartAMEX:SLV Silver Inverse Head & Shoulders Weekly Chart, The Inverse Head & Shoulders pattern is a bullish reversal pattern commonly observed in technical analysis. It typically consists of three troughs, with the middle trough (the head) being lower than the two surrounding troughs (the shoulders). This pattern suggests a reversal of a downward trend, with the price likely to move higher after the formation is complete. Traders often look for a breakout above the neckline, which serves as confirmation of the pattern and a potential entry point for long positions. The pattern is considered invalidated if the price breaks below the lowest point of the pattern.

Watch for Silver to catch-up with GoldGold has broken out of a multi-year resistance to new all-time highs. Silver has been lagging Gold. It has started to move and should accelerate in its catch up once Silver future push through 26. I am long SLV as a proxy. Silver miners may also be a great play but I don't like the rise in energy prices, which could continue to be a headwind for them.

$SLV FlaggingSome basic analysis reveals that Silver is flagging on the 3 Months chart looking for a big breakout. Collect Grandmas silverware and sell at the highs

Time for rotation??? Silver to out preform Gold??We know they have been playing games.
I personally would buy physical and stand back from PAPER Silver.
Can the silver gorillas return with strength??
NOT FINANCIAL ADVICE!!!

I'm Bullish Gold and SilverI'm Bullish Gold and Silver! I expect a rise on the VIX followed by downward manipulation of the VIX until election time, expect a lot of volatility, when the VIX and Gold and Silver break out expect a much needed stock market correction!

SLV multi month channelA no brainer buy low, sell high.
Is Silver ever going to zero? No
GLD has had a BIG breakout and SLV has not followed through (yet)
the 100/200 sma on monthly support this trade and if your time horizon is long enough, I believe this position goes back up to the supply zone.

SLV: Bullish Head and Shoulders and Piercing Line on the WeeklyThere is a Bullish Inverted Head and Shoulders with a Piercing Line on the potential Right Shoulder visible on the weekly timeframe above the 800-week EMA who's measured move would take it all the way up to the 1.272 Fibonacci Extension
if the pattern plays out.
The move up in SLV should be supported by the rising of the TLT and Falling of Yields (if that trend should continue).
I will be getting the ITM Calls, expiring April 19th.

SLV - One More Leg Down to Complete Correction
Looks like one more leg down could complete the correction from the last ATH. Potential Wave 3 projection indicates mid-40s. Be ready to pounce on any middle of the night crashes. These have turned out to be exceptional buying opportunities, every time.
I had been using the iron condor strategy for quite a while now but something's got to give, especially with the miners, that can provide greater gains once silver comes into favor. Expect a silver mania to develop, just like bitcoin, AI, etc. Too much money always chasing better gains. Just hasn't hit the precious metals sector yet, but it will.

Economic Uncertainty and the Allure of Physical Silver
Silver has emerged as a resilient and attractive option for investors seeking refuge from economic uncertainties. As we delve into the intricate analysis of AMEX:SLV stock, it becomes apparent that the interplay between Treasury yields, the U.S. Dollar, and market sentiment is crucial in understanding the trajectory of silver prices.
Treasury Yields and Dollar Dynamics:
At the forefront of silver's market dance is the 10-year U.S. Treasury yield, currently standing at 4.141%. Traditionally, higher yields bolster the U.S. Dollar, making silver more expensive in other currencies. However, recent silver performance has introduced a potential shift in this correlation, challenging conventional wisdom and prompting investors to question the metal's future direction.
Key Questions for Silver Traders:
The upcoming week poses critical questions for silver traders. Will silver's recent divergence from gold persist, or was it merely a momentary event driven by attractively low silver prices? The tone set by the Federal Reserve, particularly if it adopts a hawkish stance, could prove pivotal, potentially causing silver to relinquish its recent gains.
Silver's Response to Economic Data:
Intriguingly, silver has displayed a unique response to last week's economic reports, deviating from the well-trodden path of gold. This nuanced behavior indicates a more complex market sentiment towards silver, emphasizing the need for investors to stay attuned to the metal's independent movements.
Short-Term Outlook and Federal Reserve Impact:
In the short term, traders should brace for potential fluctuations in silver prices. While the market may continue to favor silver, the upcoming Federal Reserve meeting and comments from Fed Chair Jerome Powell will be decisive. A hawkish stance could trigger a sell-off in silver, undoing the gains from the previous week.
Investing in Physical Silver:
Against the backdrop of economic uncertainty, some investors find solace in owning physical silver, be it in the form of coins, bars, or bullion. Despite risks such as theft and storage, the convenience of online purchases from reputable dealers like APMEX or JM Bullion provides a viable option for those seeking tangible investments.
Silver Stock Performance:
With economic uncertainties lingering in 2024, silver prices have climbed back near 2023 highs, currently quoting at $22.90 per ounce, reflecting a 0.12% surge. The interest in silver and precious metals tends to rise in turbulent financial conditions or elevated inflation, prompting investors to evaluate whether current silver price levels present a buying opportunity or are poised for a pullback.
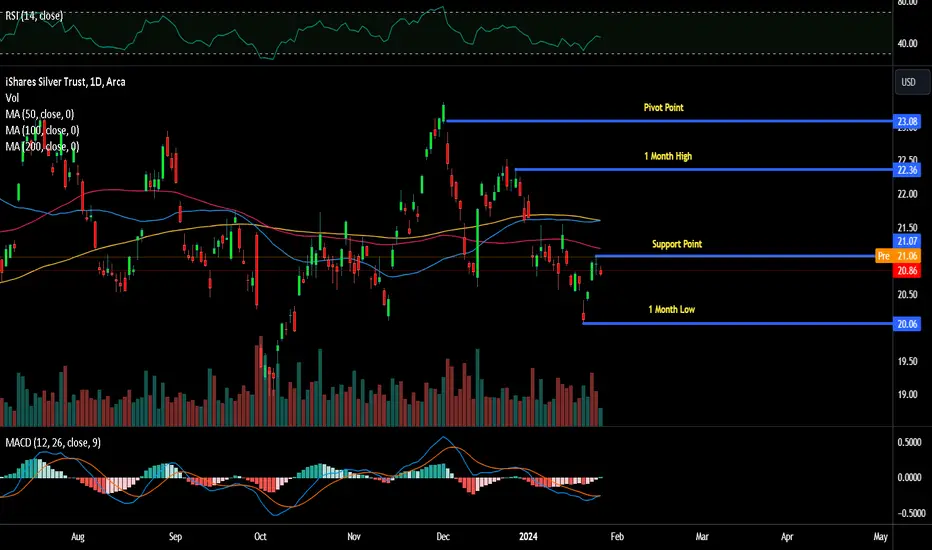
Technical Outlook:
The technical analysis of Silver Trust Ishares reveals positive investor sentiment, with prices reacting positively after breaking an inverse head and shoulders formation. A decisive break above $21.25 will signal further positivity, while a break on the opposite side may be a strong negative signal. The stock has already broken through resistance at $20.50, predicting a potential further rise.
Conclusion:
As investors navigate the complex terrain of silver investments in 2024, the confluence of Treasury yields, the U.S. Dollar dynamics, and Federal Reserve actions will shape the trajectory of silver prices. The metal's unique response to market dynamics and its resilience in the face of economic uncertainties make silver an intriguing option for those looking to diversify portfolios and hedge against inflation risks. However, the cautionary notes on physical silver ownership and the vigilance required in monitoring short-term fluctuations emphasize the need for a well-informed and strategic approach to silver investments in the current financial landscape.
SILVER Stock Chart Fibonacci Analysis 012024Trading Idea
1) Find a FIBO slingshot
2) Check FIBO 61.80% level
3) Entry Point > 21.2/61.80%
Chart time frame : D
A) 15 min(1W-3M)
B) 1 hr(3M-6M)
C) 4 hr(6M-1year)
D) 1 day(1-3years)
Stock progress : B
A) Keep rising over 61.80% resistance
B) 61.80% resistance
C) Hit the bottom
D) Hit the top
Stocks rise as they rise from support and fall from resistance. Our goal is to find a low support point and enter. It can be referred to as buying at the pullback point. The pullback point can be found with a Fibonacci extension of 61.80%. This is a step to find entry level. 1) Find a triangle (Fibonacci Speed Fan Line) that connects the high (resistance) and low (support) points of the stock in progress, where it is continuously expressed as a Slingshot, 2) and create a Fibonacci extension level for the first rising wave from the start point of slingshot pattern.
When the current price goes over 61.80% level , that can be a good entry point, especially if the SMA 100 and 200 curves are gathered together at 61.80%, it is a very good entry point.
As a great help, tradingview provide these Fibonacci speed fan lines and extension levels with ease. So if you use the Fibonacci fan line, the extension level, and the SMA 100/200 curve well, you can find an entry point for the stock market. At least you have to enter at this low point to avoid trading failure, and if you are skilled at entering this low point, with fibonacci6180 technique, your reading skill to chart will be greatly improved.
If you want to do day trading, please set the time frame to 5 minutes or 15 minutes, and you will see many of the low point of rising stocks.
If want to prefer long term range trading, you can set the time frame to 1 hr or 1 day.

Silver is close to Support & Getting Ready For a Bounce!Silver is close to Support & Getting Ready to Bounce!
* 7 red candles in a row
* Volume is dropping on the way down
* Hammer candle is being formed. Let's see how it closes today
* CCI positive Divergence
* Wide Distance between the lines in RSI
* Wide Distance between K&D in Stochastic
* Close to a lower BB Band
I am buying now, and will add more at $20.40 and $20 if it gets there.

SLV needs to make a decision on where it will go
SLV on the weekly chart is in a symmetrical triangle and is at the end of it; therefore, there is not a lot of free space for silver to coil at this level. It is almost certain silver will make a big move and pretty soon.
I am more towards the bear side of the breakout because last week silver did break out of the triangle, gold did make a new all-time high, but both of them returned to their triangles, and both show huge weakness behaving at these levels. That indicates there is no more power for a strong pump above the resistance level.
The picture is very clear. Bulls need to break out of the triangle and start pumping towards the all-time high; otherwise, if the break occurs downward, there is a huge chance we could see silver at a single-digit number.

Profit is never a bad thingIt's been a great trade so far, same senario for the miners. Lock in half - move up the stops

Silver has my attentionI know this monthly chart is a bit tough to see the detail, but if you look at the daily SLV chart you will find an inverse H&S which is breaking out. The measured move on the daily IH&S actually takes us through the breakout of the Weekly Inverse H&S that I'm showing on this monthly chart. Get yer pop-corn ready...

$SLV Inverse Head & Shoulders Pattern ### Technical Analysis Overview: Silver SLV ETF - Inverse Head and Shoulders Pattern
Investors and traders focusing on technical analysis are currently observing a significant development in the Silver SLV ETF stock chart. The chart exhibits an inverse head and shoulders pattern, a formation that is often indicative of a potential bullish reversal in the market.
#### Understanding the Inverse Head and Shoulders Pattern
The inverse head and shoulders pattern is recognized as a reliable reversal pattern in technical analysis, typically occurring at the end of a downtrend. The pattern comprises three troughs:
1. **The Left Shoulder**: The first trough, representing an initial low point.
2. **The Head**: A deeper low, forming the middle trough.
3. **The Right Shoulder**: A subsequent shallower low, forming the final trough.
This formation is considered 'inverse' because it is the opposite of the traditional head and shoulders pattern, which is typically seen at the end of an uptrend.
#### Implications for the Silver SLV ETF
In the case of the Silver SLV ETF, the completion of this inverse head and shoulders pattern suggests a possible change in the overall trend from bearish to bullish. The key moment in confirming this pattern is a break above the trend line that connects the highs of the formation - often referred to as the 'neckline'.
#### Critical Observations for Confirmation
- **Break above the Neckline**: For the pattern to be confirmed, the price of the Silver SLV ETF needs to break above the down-sloping trend line connecting the peaks of the pattern. This breakout is typically accompanied by an increase in trading volume, lending further credibility to the pattern's validity.
- **Sustained Momentum Post-Breakout**: After the breakout, it is crucial to observe whether the price can maintain its upward momentum or if it reverts below the neckline, which could invalidate the bullish signal.
- **Target Projections**: Upon confirmation, the inverse head and shoulders pattern allows for price target projections. The height of the head from the neckline can be applied above the neckline to estimate a potential upward move.
#### Considerations for Investors
For investors and traders who rely on technical analysis, the inverse head and shoulders pattern on the Silver SLV ETF chart provides a framework for making decisions. A confirmed breakout above the neckline could be interpreted as a buying signal, while caution is advised if the pattern fails to confirm.
It's important to note that while technical patterns like the inverse head and shoulders can provide insights, they should be considered alongside other technical indicators and market fundamentals to form a comprehensive investment strategy.
Bitcoin, GOLD, and SLV Rose Sharply From Israel-Hamas WarCommodities and Bitcoin experienced significant increases in value around October 7, which is the date that the Israel-Hamas War started. Commodities and Bitcoin experienced significant increases in value around October 7, which is the date that the Israel-Hamas War started. SLV had a bullish bounce off the yellow trend line on Friday October 6 (marked by the orange circle). The Israel-Hamas conflict started on Saturday, and on Monday SLV started its uptrend.
Key Price Levels:
The light blue trend line is acting as short-term resistance that is suppressing SLV's price, but the longer term target is the red trend line if SLV can continue to climb higher. The yellow trend line is a key support level to monitor for a bounce if SLV drops back down.

Will silver shine again? As in gold, possibility for a new bull market in SLV is in the cards for coming 2024.
The price structure* on weekly time-frame suggests there is a high chance that SLV, has found its bottom last year in Sep'22 and with higher low this year in Oct'23.
As long as Oct low holds, I would expect the price to move toward next resistance zones: first 22 and later important 24-25 zone. Afterwards, if price builds a handle and breaks-out above 24 that would confirm the move to 27-30-32 resistance area.
Overall, traditional fear-type assets look mid to long-term bullish to my eyes in coming months and years.
Trading thesis : I need the price to confidently move above 50D MA, and create at least short base with several days/a week of consolidation around previous basing attempts (most recent being around 21) with later break-out above this pivot to consider longs.
* Important caveat to EW: I use it solely to have a subjective idea about sentiment and overall structural context to support, but not guide, my investing decisions. Price and volume is the key, and only price pays, not the fibonacci resistance or any wave count.

Time to start a position in SLVSLV is looking very attractive at these levels.
It has entered my first gap fill starter position area.
I'm starting to add here.
RSI & COT are both looking favorable for a swing up from here.
