Higher end consumption has officially broken downThe charts of Lululemon, Louis Vuitton, Restoration Hardware & Target are showing significant signs of weakness as all of them have broken important 3M closing support lows. Regardless of what you hear, these charts show that the high end consumer has been slowing consumption for quite some time and with the June 30, 2025 quarter close all of them have broken below key 3M support zones.
Could we see a break down failure this quarter in which these charts reverse directions and go UP? Only time will tell but if they don't watch out below as the next areas of major support for some of these charts are much lower.
Although all of these are very strong companies with strong balance sheets, I will not go long these charts until I see confirmation of a breakdown failure and a 3M closing above the key support areas.
0JVT trade ideas

Lulu Long15-Minute Chart: Head and Shoulders Pattern
A head and shoulders pattern has formed on the 15-minute chart, signaling a potential reversal from a short-term downtrend, suggesting bullish momentum may be building.
Daily Chart: Hammer Candlestick & RSI Oversold
The daily chart shows a hammer candlestick pattern, indicating strong buying pressure at lower levels. Additionally, the RSI is in oversold territory, reinforcing the likelihood of a near-term rebound. These factors suggest a favorable setup for a long position in LULU.
Trade Recommendation
Consider initiating a long position in LULU based on the bullish signals across multiple timeframes.
Entry:231
Stop Loss (SL): Set at $226 (aligned with August 2024 resistance) or $219 (low of the hammer candlestick) for tighter risk management.
Take Profit 1 (TP1): Target $250–$252, corresponding to the 200-period EMA on the 1-hour and 4-hour charts, a likely resistance zone.(a 1:4 risk and reward ratio)
Take Profit 2 (TP2): Target $334, aiming to fill the gap from the last earnings report, with potential upside if tariff concerns ease.
Rationale
The combination of a reversal pattern on the 15-minute chart, a bullish hammer on the daily chart, and an oversold RSI supports a bullish outlook. Risk-reward ratios are attractive with defined stop-loss levels and realistic profit targets, contingent on market conditions and macroeconomic factors like tariff developments.

LULU LongMarket Structure Analysis
Break of Structure (BOS): A clean BOS was confirmed following a strong bullish impulse off the low at $219. This suggests a transition from a bearish trend into potential accumulation.
Higher Lows and Re-accumulation: After the BOS, price is forming a clear series of higher lows, indicating sustained demand and institutional interest. Each retracement is being absorbed, suggesting buyers are active.
Short-Term Bullish Target: The current structure points toward a bullish continuation toward the $260–262 zone, where previous structural inefficiencies and distribution events occurred.
Internal Pullbacks: Shallow pullbacks are developing within clean structural ranges, showing signs of controlled re-entries rather than panic-driven profit-taking.
🔹 Liquidity Landscape
Sell-side Liquidity Cleared: The deep wick near $219 represents a liquidity sweep, likely engineered to remove weak longs and activate institutional buy programs.
Buy-side Liquidity Above: There’s a dense cluster of untapped liquidity between $258–262, likely to be targeted before any major shift occurs. These levels also align with where many participants were previously trapped.
Trap Zones Below: The green areas highlight zones where retail might look for reversals. Smart money often uses these zones for re-accumulation or inducement.
🔹 Risk Management Considerations
Entry: Long positions are best taken on confirmation within higher low pullbacks. Avoid chasing price into premium zones.
Stop Placement: Beneath the most recent higher low or liquidity sweep to avoid being taken out by engineered wicks.
Targeting: Conservative traders may target $258; aggressive bias can push toward $262 zone.
Position Sizing: Maintain strict risk control as price approaches higher timeframe zones where momentum may shift.

Looking for a leap on LULU. OptionsMastery:
🔉Sound on!🔉
📣Make sure to watch fullscreen!📣
Thank you as always for watching my videos. I hope that you learned something very educational! Please feel free to like, share, and comment on this post. Remember only risk what you are willing to lose. Trading is very risky but it can change your life!

LULU – Compression Complete? Reversal in Progress | WaverVanir PTicker: NASDAQ:LULU
Timeframe: 1D (Daily)
Posted by: WaverVanir International LLC | VolanX DSS Framework
🧠 Technical Thesis:
LULU is showing signs of a potential macro reversal after a sharp capitulation and retest of key demand (~$235–240). The double-bottom formation and absorption at prior support suggest smart money accumulation.
📌 Trade Plan:
Entry Zone: $237–245
Target 1: $310 (Risk:Reward ~2.5R)
Target 2: $385
Target 3: $460+ (ATH retest zone)
Invalidation: Daily close below $228 (breakdown continuation)
🧭 DSS Confluence (VolanX Modules):
✅ Smart Money Concepts (SMC): Displacement followed by BOS (Break of Structure)
✅ Volume Profile: Major acceptance above $240
✅ Fibonacci Cluster: 0.618 retrace aligns with breakout targets
⚠️ Earnings Watch: Next ER marked – high volatility expected
📊 Probability Estimate:
Reversal/Breakout (Long Bias): 72%
Chop/Retest: 18%
Breakdown Continuation: 10%
📎 Macro Context:
With consumer discretionary stabilizing and earnings revisions improving, LULU may benefit from a re-rating cycle, particularly if macro tailwinds (Fed cuts, soft landing) persist through Q3–Q4 2025.
🚨 Disclaimer:
This post is for informational and educational purposes only and does not constitute financial advice. WaverVanir International LLC is not liable for any trading decisions based on this content. Always do your own research.
✅ Follow us for more DSS-backed setups.
#WaverVanir #LULU #SmartMoneyConcepts #VolanX #TradingView #OptionsFlow #VolumeProfile #DSS #InstitutionalEdge

LULU Daily | Smart Money + Fibonacci Reversal Setup📢
📆 July 1, 2025 | ⏱ 1D Chart
🔹 SMC + Volume + FVG Confluence
🔹 Powered by WaverVanir DSS Protocol
📍 Context:
LULU printed a strong bullish engulfing off the 0.786–0.886 Fibonacci retracement zone, following a BOS and liquidity sweep at $233.
Volume surged near the bottom — potential institutional absorption.
📊 Trade Plan:
🟩 Entry Zone: $244.75–$245.50
🟥 Stop Loss: $227.39
🎯 Targets (Probability-Weighted):
T1: $265.92 – Minor OB + 0.618 Fib (🎯 84%)
T2: $294.93 – Imbalance Fill + ORB Target (🎯 68%)
T3: $323.19 – Macro EQ Zone (🎯 42%)
📈 Reward-to-Risk: ~3.0+
🛡 Risk invalidated on daily close below $227.
📌 Notes:
Expecting rotation back toward equilibrium if momentum persists. Scaling partials at each TP level. Watching VWAP slope and intraday ORB behavior for momentum confirmation.
💬 Let me know if you're in this setup —
#LULU #SmartMoney #FVG #SMC #WaverVanir #TradingStrategy #OrderBlocks #VWAP #Fibonacci #BullishEngulfing #LiquiditySweep

Stocks SPOT ACCOUNT: LULU stocks my buy trade with take profitStocks SPOT ACCOUNT: NASDAQ:LULU stocks my buy trade with take profit.
Bought at 236 and take profit at 245.
This is my SPOT Accounts for Stocks Portfolio.
Trade shows my Buying and Take Profit Level.
Spot account doesn't need SL because its stocks buying account.

Lululemon Chart Breakdown Lululemon (LULU) Chart Breakdown
Buy around $200-$250 Dollar Levels
Sell/TP: Above $275-$300

Lululemon Stock Chart Fibonacci Analysis 062725Trading Idea
1) Find a FIBO slingshot
2) Check FIBO 61.80% level
3) Entry Point > 225/61.80%
Chart time frame:D
A) 15 min(1W-3M)
B) 1 hr(3M-6M)
C) 4 hr(6M-1year)
D) 1 day(1-3years)
Stock progress:C
A) Keep rising over 61.80% resistance
B) 61.80% resistance
C) 61.80% support
D) Hit the bottom
E) Hit the top
Stocks rise as they rise from support and fall from resistance. Our goal is to find a low support point and enter. It can be referred to as buying at the pullback point. The pullback point can be found with a Fibonacci extension of 61.80%. This is a step to find entry level. 1) Find a triangle (Fibonacci Speed Fan Line) that connects the high (resistance) and low (support) points of the stock in progress, where it is continuously expressed as a Slingshot, 2) and create a Fibonacci extension level for the first rising wave from the start point of slingshot pattern.
When the current price goes over 61.80% level , that can be a good entry point, especially if the SMA 100 and 200 curves are gathered together at 61.80%, it is a very good entry point.
As a great help, tradingview provides these Fibonacci speed fan lines and extension levels with ease. So if you use the Fibonacci fan line, the extension level, and the SMA 100/200 curve well, you can find an entry point for the stock market. At least you have to enter at this low point to avoid trading failure, and if you are skilled at entering this low point, with fibonacci6180 technique, your reading skill to chart will be greatly improved.
If you want to do day trading, please set the time frame to 5 minutes or 15 minutes, and you will see many of the low point of rising stocks.
If want to prefer long term range trading, you can set the time frame to 1 hr or 1 day.

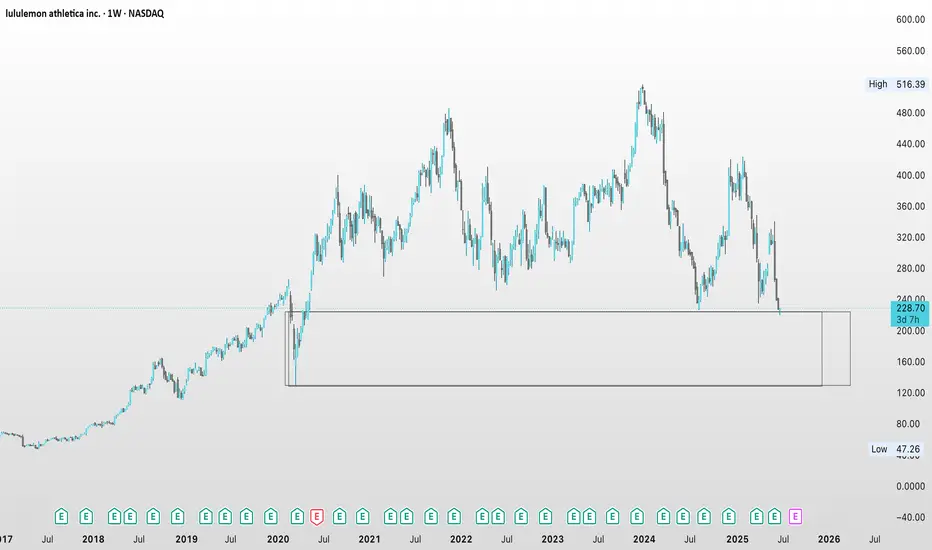
LULU into supportLulu is on sale as its just come into an area it has only sold at, 3 other times out of the past 5 years. As you can see by the Orange line, LULU has been holding this area of support for the past 5 years. This is a great buying opportunity. A close below the line on a weekly basis would stop out of the trade

Safe Entry Zone LuLuStock current at SIGNIFICANT Support Level.
P.High's & P.Lows(Previous Highs & Previous Lows) acts as good Support and resistances levels.
1D Green Zone Is Buying Zone.
1D Red Zone is Selling Zone.
Take Profit Line is where you may secure Profit in case any selling Pressure showed-up near the Line it acts as Resistance level an dangerous Zone
In case Break Through red Zone stock will change to UP-Movement and Vice Versa.
Note: 1- Potentional of Strong Buying Zone:
We have two scenarios must happen at The Mentioned Zone:
Scenarios One: strong buying volume with reversal Candle.
Scenarios Two: Fake Break-Out of The Buying Zone.
Both indicate buyers stepping in strongly. NEVER Join in unless one showed up.
2- How to Buy Stock:
On 15M TF when Marubozu Candle show up which indicate strong buyers stepping-in.
Buy on 0.5 Fibo Level of the Marubozu Candle, because price will always and always re-test the imbalance.

LULU investment ideaprice coming bck to 2020 prices,
mitigation POI at a deeep retracement
even a conservative reaction could go for imbalance
LULU 📉TechnicalAnalysis: LULU – 15-Min Chart (Short Bias)
On the 15-minute timeframe, LULU is currently forming a series of lower highs and lower lows, confirming a short-term bearish market structure. Price recently broke below a key intraday support zone near $243, which had previously held as a short-term demand area. This breakdown was followed by a weak bullish retracement, suggesting supply is in control.
The retracement failed to reclaim the previous structural break, forming what looks like a bearish continuation flag or supply retest, providing an ideal short entry opportunity.
Price is currently trading below the 50-period EMA, and momentum indicators are showing bearish divergence, with price attempting minor higher wicks while momentum (measured via RSI or MACD) continues to trend downward.
From a Smart Money Concepts (SMC) perspective, the internal structure shifted bearishly after a clear break of structure (BOS). Price is reacting to a prior liquidity sweep above $248 before dropping, showing signs of institutional distribution. That high can now be considered a short-term supply origin, and price continues to respect that imbalance.
🔻 Price Target: $225
The next key HTF (higher-timeframe) inefficiency zone lies near $225, aligning with:
Daily bullish OB that hasn’t been mitigated
Previous strong bounce zone
A potential magnet for resting liquidity
📊 Fundamentals Supporting the Bearish Move
Earnings Outlook & Valuation Concerns: LULU's most recent earnings beat expectations, but guidance was tepid, and margin compression was noted, especially on international expansion and inventory buildup.
Consumer Sentiment Shift: Discretionary spending has weakened post-COVID boom in premium apparel; market is rotating into staples and discount retail.
Technical Selloff in Growth Sector: Broader weakness in growth stocks and high-beta names following hawkish Fed commentary reinforces LULU’s downside risk.

6/16/25 - $lulu - Comment at low $240s6/16/25 :: VROCKSTAR :: NASDAQ:LULU
Comment at low $240s
- see comment from 6/6/25 about why $260 post EPS was "interesting" but not obvious to own ST
- now we're only down a modest ~10% from there, so not much has really changed, except discretionary stocks have further drained. so this is not LULU specific per se, but sector/ factor beta
- when you take LT leases out of the EV of ~29.3 bn as of writing, or about 1.5 bn = you get ~27.8 bn. when you consider PF capex is about 500 mm (ex growth)... you end up with FCF this year of ~1.5 bn. so 1.5/ 27.8 = 5.4%.
- in the current macro where consumer has yet to really trough, or where we get "all clear cut to rates" (which is not my base case - if anything i think rates could stay sticky or even head higher in the ST), this means yield for this type of name post the last EPS comms might have to approach 6-7% all else equal
- the mid teens PE of ~16x is "buy" (again referencing the last note), but in this sort of macro/ environment, 13...14...15x is also reasonable until the mkt can underwrite exactly where the "trough" will be and start to put a more comfortable '26 estimate on the stock (we're not there).
- right now there are only three discretionary names i like in this order: NYSE:ANF > NYSE:YETI > $lulu. i only own NYSE:ANF b/c the FCF yield is nearly 15% on my est. and growth/ mgns also decent/ last EPS was "good". I trade around NYSE:YETI (don't currently own), and i see reason NASDAQ:LULU could get a ST bid here all else equal, so i'm playing a bit of a ST bounce here in the $240 region with some slight ITM option exposure for july.
- however, i'm aware that the low is probably not in
- and i've also seen this stock make nice mean reverting moves before it needs to find a lower level especially b/c the brand is great, the growth is not over... and eventually this will be a top tier discretionary name to own and the mkt is currently pricing it as such, anyway, at mid teens EPS when the rest of the B tier stuff is already single digits. *there's a reason for that*.
- food for thought.
V

LULU eyes on $243-248: Decent Support to buy after Earnings DumpLULU earnings report caused a severe dip in price.
It is now testing a serious support at $243.81-248.17
Look to hold, or stab below and come back above.
.
Last Plot that gave PERFECT entry and exit:
.

LULU watch $268 (again): Double Golden fibs may Break this timeLULU bounced back into the tight confluence of Goldens.
Golden Genesis at $267.70 and Golden Covid at $268.74.
These mark a major landmark in the lifetime of any asset.

Head and Shoulders PatternLululemon’s chart looks extremely bearish. It’s make or break for this stock. A breakdown of its current support would confirm the break of the neckline in a Head and Shoulders pattern. The 1:1 extension of the move could send the stock price down another 50%, towards $130. Yikes!
The 5 Wave supercycle ended at the Head, around $520. The stock then crashed in an abc correction, rejected at the golden ratio at $420. We are now hanging onto support, $234 is the last hope before potential calamity.
That might seem dramatic but all it would take is for tariffs to eat into the profits and the company will be under significant margin pressure. The technicals and fundamentals don’t look great.
Be careful buying the dip on here. It looks like a falling knife. I’d rather be short, but currently have no position.
Not financial advice, do what’s best for you.

Going to HonoLULULululemon shares fell almost 20% after the company warned tariffs and consumer caution would hurt profits.
Here are some of my bold statements about this:
Tariffs are sector-wide, not Lululemon-specific
Nearly all premium athletic and apparel brands—Nike, Adidas, Under Armour, VF Corp (The North Face), Alo Yoga, Vuori—rely on Asia-based manufacturing, especially China and Vietnam.
This means everyone faces the same cost inflation, and no brand gains a unique cost advantage from the tariff hit.
Lululemon has superior margin cushion
LULU has ~58–59% gross margins, which is well above peers like Nike (~44%) or Under Armour (~46%).
This gives Lululemon more flexibility to absorb or pass on costs than competitors.
Loyal customer base allows for price elasticity
Lululemon’s brand power, community focus, and premium positioning give it pricing power. Consumers are often less price-sensitive.
Modest price increases (e.g. $5–10 on leggings) may not meaningfully affect demand—especially compared to fast fashion retailers.
And some points about performance of the business:
Forward P/E now ~18×, down from its historical 30–35× range—this marks a meaningful valuation discount relative to its growth profile
International comparable sales surged: +39% in China, +25–36% in rest-of-world markets recently
Executed ~$1 billion in stock repurchases recently, with ample remaining capacity—supports EPS and investor confidence
Multiple firms (Bernstein, Raymond James, TD Cowen, Needham, Baird) maintain Buy/Outperform ratings with targets in the $420–475 range
For LULU´s 1Q official report visit: corporate.lululemon.com

LULU Swing Trade Plan – 2025-06-06📉 LULU Swing Trade Plan – 2025-06-06
Bias: Moderately Bearish
Timeframe: 5–10 days
Catalyst: Oversold momentum, heavy put OI, technical downtrend
Trade Type: Single-leg put option
🧠 Model Summary Table
Model Direction Strike Entry Price Targets Stop Confidence
Grok Moderately Bearish $240 PUT $0.75 +50% < $235 stock 72%
Claude Moderately Bullish $280 CALL $2.74 +45–100% –50% premium 75%
Llama Moderately Bearish $260 PUT $4.40 +50% ($6.60) $2.00 75%
Gemini Strongly Bearish $240 PUT $0.75 +100–200% $0.37 75%
DeepSeek Moderately Bullish $300 CALL $0.64 +100–200% $0.32 75%
✅ Consensus: Oversold with strong bearish trend
⚠️ Disagreement: Some models expect a bounce; others expect continued capitulation
📉 Technical & Sentiment Summary
Trend: Strong multi-timeframe bearish (price below all major EMAs)
RSI: Deeply oversold across charts
MACD: Bearish with early signs of momentum fading
Sentiment: Heavy put OI at $240/$260, falling VIX, some speculative reversal interest
Max Pain: $300 (well above current)
✅ Final Trade Setup
Parameter Value
Instrument LULU
Direction PUT (SHORT)
Strike $260
Expiry 2025-06-20
Entry Price $4.40
Profit Target $6.60 (≈+50%)
Stop Loss $2.20 (≈–50%)
Size 1 contract
Entry Timing At market open
Confidence 75%
💡 Rationale: Balanced premium vs. downside exposure, fits current trend and offers high R/R around near-the-money strike
⚠️ Key Risks & Considerations
Oversold RSI: May cause short-lived relief rally
Macro Reversal: Broader risk-on rally or LULU-specific positive catalyst could invalidate trade
Theta Decay: Accelerates next week → use time-based stop if trend fades

6/6/25 - $lulu - Buy $260s, but not "need" to own6/6/25 :: VROCKSTAR :: NASDAQ:LULU
Buy $260s, but not "need" to own
- stock is objectively a buy here in the $260s, let's get that out of the way
- but when it comes to "what can happen next" or "what's the floor/drawdown", i think a few considerations
- flat EPS guide in '25 is not bc of structural issues w brand, so high teens PE esp on '26 #s is reasonable and FCF supports in mid to high 4s on '26 ests.
- the main fly in the ointment is obviously the US consumer and recession issues (second would be tariffs and ability to take price - which they talked on conf call - into this "weaker" consumer)
- ultimately i'd expect the stock to recover a bit here into the high $200s... perhaps $280 such macro doesn't fall to pieces immediately, but will be hard to see stock recover $300 soon.
- i also tend to think the lows could be tested if we get a risk off moment sooner vs. later
- and this isn't a "need to own" in my book at the moment, esp while i'm packing high conviction on obtc, nxt, gamb, tsm and starting to wrangle tsla as of y'day.
- so let's see.
- i won't get *too* greedy. i'm tempted here.
tldr
- but my target is probably in the sub $250 level to start biting and building position
be well my friends, have a good weekend!
V

LULU Earnings Setup – Undervalued Deep OTM Put Play?🧘♀️ LULU Earnings Setup – Undervalued Deep OTM Put Play? 💣
📅 Earnings: June 5, 2025 (AMC) | ⏳ Expiry: June 6, 2025 (1D)
🎯 Strategy: Low-premium put for “sell-the-news” drop after extended rally
🔍 Multi-Model Analyst Summary
Model Bias Strike Premium Confidence Comment
Grok/xAI Moderately Bullish 335C 14.45 65% IV high, but calls rich
Claude Moderately Bearish 330P 12.75 65% Max pain gravity
Llama Moderately Bullish 340C×2 12.15 80% Above key MAs, peers strong
Gemini Moderately Bearish 302.5P 3.15 65% Heavy put OI at $325
DeepSeek Moderately Bearish 285P 0.88 65% Unusual put volume at $285
📊 Technical & Sentiment Highlights
IV Rank: 0.68 → High risk of IV crush post-earnings
Expected Move: ±8.49% (~$28.45)
Max Pain: $325 – indicates potential pullback/pin scenario
Key Risk Factors: Governance flags, mixed sector sentiment, peer strength offsets margin concerns
Liquidity Check: $285 put OI = 2,725; volume = 2,088 → ✅ tradable
🎯 Trade Setup – Earnings Put Play
Instrument: LULU
Direction: PUT (SHORT)
Strike: $285.00
Expiry: 2025-06-06 (Friday)
Entry Price: $0.88
Profit Target: $1.00 (≈13.6% gain)
Stop Loss: $0.25 (≈71.5% of premium)
Size: 1 contract
Entry Timing: End of day 6/5 (pre_earnings_close)
Confidence Level: 70%
⚠️ Risk Management Notes
💥 Requires big move (~15.3% drop to break even)
⏳ 1-day expiry = fast theta burn – quick exit post-earnings
🎢 IV Crush: Even a small move might not offset premium decay
🧾 Audit-related risk: News drop or weak guidance could trigger panic selling
🧠 Rationale
After a strong run-up into earnings and elevated IV levels, LULU is vulnerable to a "sell-the-news" event. The $285 put is deep OTM but has strong volume and fits within the low-risk, high-reward zone. Risk is capped, and reward could exceed 100%+ with a strong bearish move.

Lululemon Looks Poised for Upside Ahead of EarningsTargets:
- T1 = $326.75
- T2 = $345.50
Stop Levels:
- S1 = $312.50
- S2 = $308.00
**Wisdom of Professional Traders:**
This analysis synthesizes insights from thousands of professional traders and market experts, leveraging collective intelligence to identify high-probability trade setups. The wisdom of crowds principle suggests that aggregated market perspectives from experienced professionals often outperform individual forecasts, reducing cognitive biases and highlighting consensus opportunities in Lululemon.
**Key Insights:**
Lululemon is a top contender in the premium athletic apparel sector, supported by strong brand loyalty, impressive consumer demand, and margin stability. Its consistent focus on innovation, international expansion, and diversification of product offerings establishes a strong foundation for growth. Next week's earnings could serve as a major catalyst, with particular attention on the company's ability to navigate inflationary pressures and drive profitability. Technical analysis suggests an actionable long position given proximity to strong support levels and upside in price targets.
**Recent Performance:**
Lululemon has maintained robust growth, outperforming many peers in the discretionary retail sector. Despite broader macroeconomic uncertainties, high-income consumers continue to spend on premium products, positively affecting Lululemon's revenue streams. The company's international arm, particularly operations in China, remains a key driver for future growth.
**Expert Analysis:**
Analysts are optimistic ahead of earnings, citing strong consumer demand, improved inventory management, and effective product diversification strategies. International markets like China are expected to offer significant long-term upside. Concerns persist around inflationary impacts on production and currency-related headwinds, but strong management practices could mitigate these risks. The focus will also be on footwear sales and revenue from new product lines during the earnings call.
**News Impact:**
Lululemon’s earnings report next week is expected to offer deeper insights into its growth strategy amid economic challenges. Expansion in lucrative markets like China and innovation in product categories (e.g., footwear) will likely dominate investor conversations. Any updates related to operational challenges or successes could prompt swift price action. Investors should also watch for commentary on margin trends and promotional pricing strategies.
**Trading Recommendation:**
Given strong fundamentals, favorable technical setups, and high investor optimism, traders should consider a bullish position on Lululemon before its earnings report. Price targets suggest upside potential for momentum-driven traders, while stop levels provide risk mitigation in case market conditions worsen during critical periods.

LULU watch $268: Double Golden fibs to end bounce or Bottom IN? LULU bounced a bit into a tight confluence of Golden's.
Golden Genesis at $267.70 and Golden Covid at $268.74.
These mark a major landmark in the lifetime of any asset.
Rejection here would point to lower lows.
Break and Retest would be long entry signal.
Likely is an "orbit" of these before any move.
===================================================
.
