Possible Cup and Handle on LULUPrice has moved up to previous ATH. THe prior price action resembles a cup pattern. Earnings this week, possible price retracement to red line. I will use options to trade earnings.
Not financial advice
0JVT trade ideas

Lululemon ($LULU) Plunges 18% on Disappointing OutlookLululemon Athletica Inc. ( NASDAQ:LULU ) encountered a tumultuous Morning trading trading session on Friday, with shares plunging 18.47% following the company's release of guidance that failed to meet analysts' expectations. Amidst challenges in its Americas business and a notable shift in U.S. consumer behavior, the Vancouver-based activewear retailer painted a cautious picture for the upcoming quarter and full year.
Lululemon ( NASDAQ:LULU ), a prominent name in the activewear industry, experienced a stark decline in its stock price on Friday, as investors grappled with the company's subdued outlook for the near future. Despite reporting impressive earnings and revenue figures for the holiday quarter ending January 28, Lululemon's forward guidance fell short of Wall Street's estimates, triggering a sharp sell-off.
CEO Calvin McDonald acknowledged the evolving dynamics in the U.S. consumer landscape during the company's earnings call, attributing the slower start to the year to shifting consumer preferences and constraints in sizing and color options. While international sales, particularly in China, displayed robust growth, concerns lingered over stagnating sales in the Americas region, signaling potential challenges ahead.
Analysts had anticipated stronger revenue and earnings projections for both the current quarter and full year, but Lululemon's guidance painted a more conservative picture, citing uncertainties in consumer behavior and market conditions. The company's outlook, which forecasts modest top-line growth and diluted EPS figures below consensus estimates, raised apprehensions among investors about the sustainability of its growth trajectory.
Technical Outlook
Lululemon ( NASDAQ:LULU ) stock is currently trading below its Moving Averages indicating selling pressure on the ticker, further ascertaining to the thesis, is the weak Relative Strength Index (RSI) of 26 indicating the bears are pushing the share price lower.

Lululemon & Nike : Trade OpportunityLululemon is gapping down on earnings despite a double beat.
Nike is gapping down on earnings.
A trend is showing weakness in these consumer discretionary based stocks.
There will be many sympathy plays in the retail space.
Watch XRT tomorrow.

LULU - BullishLulu has a good long setup. Probabilities are in our favour to take a $16 move or higher on this ticker.
Not financial advice. Good luck

LULU Lululemon Athletica Options Ahead of EarningsIf you haven`t bought LULU before the previous earnings:
Then analyzing the options chain and the chart patterns of LULU Lululemon Athletica prior to the earnings report this week,
I would consider purchasing the 470usd strike price Calls with
an expiration date of 2024-7-19,
for a premium of approximately $39.50.
If these options prove to be profitable prior to the earnings release, I would sell at least half of them.


Re-Entry - Buy LULU - 5th wave pivot identifiedRe-entered Lulu here at 446. The continued downward trend followed the ABC subwave from the previous entry (white circle) and now has the support of the bottom of falling wedge pattern. Price reversal and pivot from the end of wave 4. Buying (again) today with 1% allocation. Open @ 446.5 TP @ 509 c.14%
‐--‐-----------
Strategy:
Based on Elliot wave theory, pivot points and classic chart patterns. The 5th wave pivot strategy identifies the last impulse of the Elliot wave sequence. The 5th wave can be equal to the 3rd wave or extend to the 1.618 Fibonacci level.
Entry: A position is taken when a pivot point is reached at the end of the 4th corrective wave and the price reverses. This position is also confirmed by bouncing from the lower bound of a chart pattern or from price support level.
Exit: TP is taken from top of wave 3 or the previous resistance level.

Bullish Breakout on LULU above 466LULU is entering a really important level here and is close to breaking out of a ~3 month descending channel. As a result, I would expect a strong move at breakout if we get one and a swift move to 483 with a high chance of testing 491 in the next few trading sessions.

LULULululemon athletica inc., commonly known as lululemon, is a Canadian-American multinational athletic apparel retailer headquartered in British Columbia and incorporated in Delaware, United States.
A decent attempt to push to continue the upward momentum.

LULU Wedge BreakoutLULU has broken out of a wedge after hitting ATH and then consolidating all of January. Bounce perfectly off the 50 EMA on the daily. Active trade now. Targets $500, $515

Lululemon Pulls BackLululemon Athletica ended last year by climbing to new record highs. Now it’s pulled back, and may draw attention from dip buyers.
The first pattern on today’s chart is the December 8 breakout after earnings and revenue beat estimates. LULU has given back most of the gains and revisited the pre-earnings closing high. Will old resistance become new support?
Second, the retailer formed a hammer candlestick around the same level. That may suggest buyers are stepping in.
Next, the current price area has potential confluence with the 50-day simple moving average.
Fourth, stochastics have dipped to an oversold condition.
LULU may need to stabilize for a few sessions given its drop since December. If the current price zone holds, longer-term trend followers may look for a continued move to all-time highs.
TradeStation has, for decades, advanced the trading industry, providing access to stocks, options, futures and cryptocurrencies. See our Overview for more.
Important Information
Past performance, whether actual or indicated by historical tests of strategies, is no guarantee of future performance or success. There is a possibility that you may sustain a loss equal to or greater than your entire investment regardless of which asset class you trade (equities, options, futures or cryptocurrencies); therefore, you should not invest or risk money that you cannot afford to lose. Online trading is not suitable for all investors. View the document titled Characteristics and Risks of Standardized Options at www.TradeStation.com . Before trading any asset class, customers must read the relevant risk disclosure statements on www.TradeStation.com . System access and trade placement and execution may be delayed or fail due to market volatility and volume, quote delays, system and software errors, Internet traffic, outages and other factors.
Securities and futures trading is offered to self-directed customers by TradeStation Securities, Inc., a broker-dealer registered with the Securities and Exchange Commission (“SEC”) and a futures commission merchant licensed with the Commodity Futures Trading Commission (“CFTC”). TradeStation Securities is a member of the Financial Industry Regulatory Authority, the National Futures Association (“NFA”), and a number of exchanges. TradeStation Crypto, Inc. offers to self-directed investors and traders cryptocurrency brokerage services under federal and state money services business/money-transmitter and similar registrations and licenses.
TradeStation Securities, Inc., TradeStation Crypto, Inc., and TradeStation Technologies, Inc. are each wholly owned subsidiaries of TradeStation Group, Inc., all operating, and providing products and services, under the TradeStation brand and trademark. TradeStation Crypto, Inc. offers to self-directed investors and traders cryptocurrency brokerage services. It is neither licensed with the SEC or the CFTC nor is it a member of NFA. When applying for, or purchasing, accounts, subscriptions, products and services, it is important that you know which company you will be dealing with. Visit www.TradeStation.com for further important information explaining what this means.

Lulu
Lulu had a slight dip this morning, and I took the opportunity to add another contract. The chart still appears promising, and the market seems to be shaping up similarly to yesterday.

Lululemon's Strong Holiday Season Signals Power Move in Retail
Lululemon Athletica Inc. emerges as a standout player in the retail game, defying earlier cautious sentiments and setting a tone of confidence. The sportswear giant recently revised its fourth-quarter sales and profit forecasts, surprising both investors and industry observers alike. In a move that reflects resilience amidst economic challenges, Lululemon has not only weathered the storm but is flourishing, offering a compelling narrative for potential buyers.
1. Festive Boost Exceeds Expectations:
Lululemon's decision to raise its fourth-quarter sales outlook comes on the heels of a holiday season that surpassed initial projections. Contrary to earlier concerns about consumer restraint due to inflation and interest rates, the company experienced robust demand, driven by enticing discounts and strategic deals. CFO Meghan Frank's statement underlines the success of Lululemon's balanced sales trends across channels, categories, and geographies.
2. Strategic Forecast Adjustments:
The upward revision in revenue guidance, now ranging between $3.170 billion and $3.190 billion, showcases Lululemon's confidence in its sustained performance. The revised profit-per-share projections of $4.96 to $5.00, up from the previous range, hint at the brand's financial strength and ability to navigate challenges effectively.
3. Online Sales Surge and Margin Boost:
The rise of online sales, aided by discounts and "buy now, pay later" plans, played a pivotal role in Lululemon's success. Despite a highly promotional retail environment, the company reports that shoppers are making purchases at full price, contributing to impressive gross margins. This defies the common narrative of heavy discounts eroding profitability.
Conclusion:
Lululemon's recent performance not only defies industry expectations but also signals a bullish outlook for the sportswear market. The company's ability to adapt to the evolving retail landscape, capitalize on online trends, and maintain strong margins paints a compelling picture for potential investors.

LuluLULU has shown a promising reversal candle, and my upcoming targets for this week are set at $498.57 and $502.18.

Short Lululemon 1-6months out putsIt's late at night I just wanted to mention this. I'm hoping to fill two puts in the morning when the market opens.
LULU 505p 1/26/24 currently at 17.03
LSE:500P 2/16/24 currently at 13.20
$490p 2/16/24 at 15.93
Hopefully LULU doesn't open too red so my order will fill. Going to do more DD in the morning. I will keep this idea updated. Cheers

Lululemon Athletica ( NASDAQ: $LULU) Continuous Bullish TrendThe 50-day Moving average is above the 200-day moving average indicating the bulls are driving NASDAQ:LULU price up.
Investors have been pushing the share price higher, NASDAQ:LULU still appears to have upward momentum. This is a positive sign for the stock's future value.
The candle stick movement of NASDAQ:LULU indicates a large Bullish Harami forming.

$LULU: Low risk trend signal...Lululemon is a strong investment with a loyal customer base and a healthy balance sheet. The company is well-positioned to benefit from the expected decline in interest rates and inflation.
Time@Mode shows a low risk entry in quarterly scale here, with worst case scenario downside being a drop under $326.93, which considering potential upside, makes this a very attractive reward to risk trade.
Best of luck!
Cheers,
Ivan Labrie.

$LULU looks like a great long-term shortChart is self explanatory. Rising wedge forming inside of a H&S top pattern.
Target in the rectangle below. Will likely take 6-9 months to play out.

Lululemon Could Be RunningLululemon spent more than half of 2023 in a range, but now it could be starting to run.
The first pattern on today’s chart is the bullish gap after LULU was added to the S&P 500 last month. The stock pulled back in late October, made a higher low and proceeded to a new 52-week high. That may suggest it’s trying to break out.
Second is the range between $415 and $420, near the mid-October peak. Prices have pulled back to test that zone. Trend followers may now watch to see whether it makes a higher low. Can old resistance become new support?
Third, you have the rising moving averages. The 8-day exponential moving average (EMA) is above the 21-day EMA. The 50-day simple moving average (SMA) is above the 100-day SMA. That may suggest that both the short- and long-term trends are bullish.
Fourth, notice how LULU gapped higher following its last three quarterly reports. Will that keep buyers engaged into the next set of numbers estimated for December 7?
Finally, MACD is rising.
TradeStation has, for decades, advanced the trading industry, providing access to stocks, options, futures and cryptocurrencies. See our Overview for more.
Important Information
TradeStation Securities, Inc., TradeStation Crypto, Inc., and TradeStation Technologies, Inc. are each wholly owned subsidiaries of TradeStation Group, Inc., all operating, and providing products and services, under the TradeStation brand and trademark. TradeStation Crypto, Inc. offers to self-directed investors and traders cryptocurrency brokerage services. It is neither licensed with the SEC or the CFTC nor is it a Member of NFA. When applying for, or purchasing, accounts, subscriptions, products, and services, it is important that you know which company you will be dealing with. Please click here for further important information explaining what this means.
This content is for informational and educational purposes only. This is not a recommendation regarding any investment or investment strategy. Any opinions expressed herein are those of the author and do not represent the views or opinions of TradeStation or any of its affiliates.
Investing involves risks. Past performance, whether actual or indicated by historical tests of strategies, is no guarantee of future performance or success. There is a possibility that you may sustain a loss equal to or greater than your entire investment regardless of which asset class you trade (equities, options, futures, or digital assets); therefore, you should not invest or risk money that you cannot afford to lose. Before trading any asset class, first read the relevant risk disclosure statements on the Important Documents page, found here: www.tradestation.com .

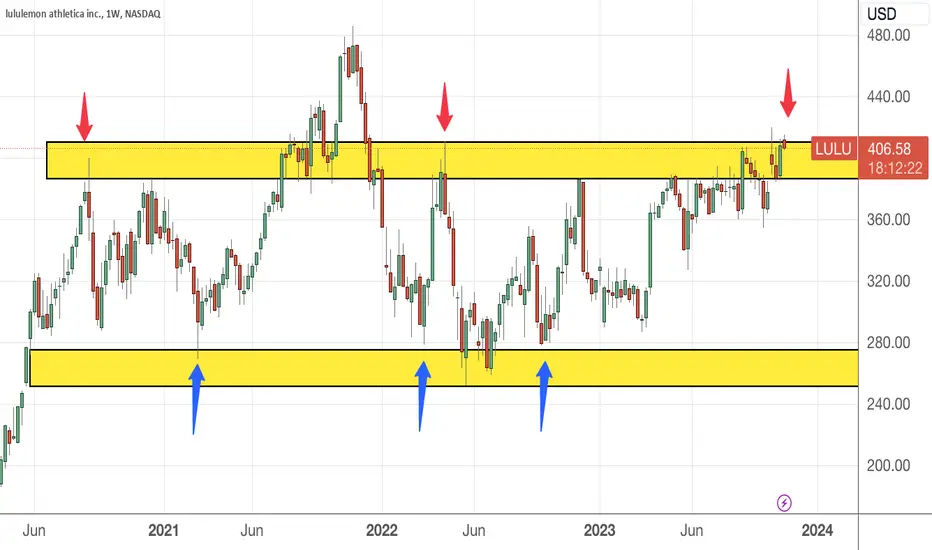
LULU is at a consolidation phaseYou can see from the weekly chart that prices are going sideways since 2020, much like a pinball hitting the ups (resistance) then rebound off the lows (support) for 3 years. So, if you had bought this stock in 2020, you probably have a roller coaster ride of being happy and feeling frustrated.
If it can breaks out from the current resistance level , ie 387-410 , then we are safer to say it is trending up. However, nobody can say for sure as it has happened in Sept 2021 where it breaks out , only to come tumbling down..........
There are naturally short term traders who are adept at finding opportunities to long and short in this phase but is a RISK you have to take, if your heart can take it. Else, I say sit on the fence and wait or look for better stocks. As I said, buying process is easy, it depends on how much you have (capital) and how much you want to buy and at less than 30 seconds, you can become a shareholder of these companies.
The trick lies in the homework prior to hitting the buy button. Always take what others write with a pinch of salt (including mine) and do your own research. Over the years, I have discover the stock market is a good reflection of one's thoughts, psychology and emotions. What you buy, when and why reveals a lot about your inner thoughts at that moment.
Hopefully, we made less mistakes and cheaper ones compared to the profitable ones in the long term in order to grow your wealth.
Lululemon Falling WedgeFalling wedge pattern is a bullish formation.. 400 - 425 can come as resistance.
Extreme fear in markets right now. Once we break down out of the bear flag on the weekly timeframe a larger sell will come once again.

Ascending TrianglePossibly heading for support.
Spinning top/indecision/at resistance.
Engulfing candle/bearish/today.
Top line is virtually flat (Resistance) and bottom line slopes up (support)
Things can change in a heart beat.
This stock does well at earnings as a rule.
You can calculate targets by projecting the width of the wide end of this triangle and projecting that measure up or down from the beak point.
Loose triangle as price is spread out somewhat. Triangles perform better when they are tight.
No recommendation

We are going down to the trend 200$According to the butterfly, we will have a decline to the trend in the area of ~ $ 200, I would not have taken a position earlier. Next, we must go to new heights.
