MVIS WeeklyEasy MVIS trading:
Simple 3 steps.
***All 3 rules need to be true before buying or selling***
Steps to BUY. (Orange circles on chart indicate buy signal.)
1) Price under white moving average.
2) Bottom indicator - Red and white lines are under the yellow horizontal line.
3) Above indicator - Green line under the yellow horizontal line.
When all 3 of these rules are true, then it's a buy signal.
Steps to SELL. (Blue boxes on chart indicate sell signal.)
1) Price above white moving average.
2) Bottom indicator - Red and white lines are above the yellow horizontal line.
3) Above indicator - Green line above the yellow horizontal line.
When all 3 of these rules are true, then it's a sell signal.
0K17 trade ideas

MVIS RangeMVIS fell back down into its parallel channel.
$3.39 is resistance. If MVIS can break above this price and hold it as support,
that would be bullish.
If MVIS can't find $3.39 at support, then this stock could be in trouble.
Currently $1.95 is an area of support, and it tested and confirmed this level as support on April 2023.
If price falls below $1.95, the next support level is the bottom of the channel at $1.11.
MVIS continues to make lower highs, and is in a downtrend, in the big picture.
Time will tell if a lower low will form.
17 cents is the previous low.

$MVIS conspiracy grade TA for the homiesSS + EWT + FTL = $?
Using Elliot wave theory plus Fib time lines to predict future price targets and movements on MVIS

$MVIS Post Resistance Short SqueezeOver the course of the last few days MicroVision, Inc. (NASDAQ: MVIS) stock has garnered a lot of social media attention after it skyrocketed more than 100%. As things stand, MVIS stock recently broke its $6 resistance and is continuing to move along its upward trajectory while its short interest continues increasing. In light of this, MVIS appears to be a prime short squeeze play to watch closely over the coming weeks.
MVIS Fundamentals
Although MVIS is considered an impressive pioneer of laser tech, the reason it is in the spotlight at the moment is not laser related. Instead, MVIS is grabbing investors’ attention thanks to its short squeeze potential with the stock running more than 100% YTD. Recently, MVIS broke a key resistance level near $6, and given the attention it is receiving, the stock may continue running to retest its next resistance at $9.82 – which would be a 34% gain from current levels.
With this in mind, MVIS is highly shorted with a short interest rate of 27% and 34% of its float on loan. If MVIS continues in its trajectory, more investors might be inclined to buy the stock to force short sellers to cover their positions which could lead to the stock soaring. In light of this, MVIS could be an interesting play to watch over the coming weeks in anticipation of a retest of the $9.82 resistance.
MVIS Financials
According to its Q1 report, MVIS’s assets increased QoQ from $114 million to $123 million which is partially due to its cash balance increasing from $20 million to $23 million. On the other hand, its liabilities drastically increased from $ 25.2 million to $36.7 million.
While MVIS increased its revenues YoY from $350 thousand to $782 thousand, its net loss increased from $13 million to $19 million, which was due to its operating expenses, which increased from $13.4 million to $21.4 million.
Technical Analysis
MVIS stock is in a bullish trend and is trading in an upward channel. Looking at the indicators, MVIS is trading above its 200, 50, and 21 MAs which are bullish signs. The RSI is neutral at 58, and the MACD is curling bearishly. MVIS recently broke a key resistance at $6 and is continuing to climb with increasing momentum. With this in mind, investors could wait for the stock to retest its support to add shares in anticipation of a run near $9.82.
As for the fundamentals, MVIS’ most notable catalyst is its high short data. Given the bullish sentiment surrounding the stock, MVIS could continue running as short sellers might be forced to cover their positions with the stock already up more than 100% YTD.
MVIS Forecast
Many investors are keeping an eye out for MVIS after it bulldozed through its resistance. As is, the stock has high short interest and appears to be on its way to retesting the $9.82 resistance. Considering the stock’s growing momentum as a prime short squeeze candidate, MVIS stock could be one to watch over the coming weeks.

MVIS | InformativeNASDAQ:MVIS
Technical Analysis for MVIS:
If MVIS breaks above the bullish line of $4.24, it may indicate a bullish signal, suggesting potential upward price movement. In this scenario, the first target price (TP1) could be set at $5.01, while the second target price (TP2) could be set at $5.86.
Conversely, if MVIS breaks below the bearish line of $3.69, it may suggest a bearish signal, implying potential downward price movement. In this case, the first target price (TP1) could be set at $2.88, and the second target price (TP2) could be set at $2.35.
Fundamental Analysis for MVIS:
MicroVision Inc. (MVIS) is a technology company that specializes in developing laser scanning technology for automotive lidar sensors, augmented reality (AR) displays, and consumer electronics. The company's core technology, known as MEMS (Micro-Electro-Mechanical Systems) scanning, enables high-resolution and low-power consumption displays and sensing solutions.
MVIS operates in the growing markets of automotive lidar and AR displays, which offer significant potential for future growth. Lidar technology plays a crucial role in enabling autonomous driving systems by providing accurate depth perception and object detection capabilities. As the automotive industry continues to embrace autonomous driving technology, the demand for lidar sensors is expected to increase.
In addition, MVIS's AR display technology offers immersive and interactive visual experiences across various industries, including gaming, entertainment, and enterprise applications. The adoption of AR technology is on the rise, driven by the increasing demand for enhanced user experiences and applications in fields such as healthcare, education, and industrial training.
MVIS has been actively engaged in strategic partnerships and collaborations to enhance its market presence and accelerate the commercialization of its technologies. These partnerships help expand the company's reach, leverage industry expertise, and access additional resources for research and development.

MVIS Springback TestCurrently retesting lows for the 3rd time and showing bullish divergence. Nearing earrings and a breakout point, fib targets on chart.

MVIS Bullish; Broke 2 Year DowntrendMVIS Broke today the 2 Year Downtrend. Tomorrow it is testing the 200 Daily Moving Average. Huge Short Float.

$MVIS Long IdeaSmall cap runners of 2021 moving again. $MVIS long downtrend looks good for a reversal. Long as MoMo continues in the market, $MVIS is a good candidate for huge run-up.

$MVIS ~ Correction still in progress...As expected, the bitcoin miners are correcting along with bitcoin itself. Although we are getting close to the 61.8 for a normal wave 2, I would recommend being careful as crypto tends to correct a little deeper and should be no surprise to see the 78.6. Remain patient and it will pay off later down the road.

MVIS high volume and price actionMVIS shows some volume and price action, Price ceiling is around 12 and stop loss around 3.80. Right now 4.80. This is 1:7 risk / reward

MVIS Squeeze targets (WSB now, great)Okay, I was scanning for break out trends on short squeeze as I do often for some of my biggest winners and Had bought in last night after hours. Then I read more and find WSB is talking about this stock. Well pile in boys! I tend to see that horizontal fibs are where highs and lows bounce from, and the closes matter more on the trend channel. Based on that, I've projected out a retake of previous channel as defined by last spike, and extrapolated that. The first run through Mid april will be telling. If it's half the price of my projection, I'm out and expect little else. But if it can go for the 50% of that channel, which it should if it gets into that channel and closes at all, then we've got a game to play.

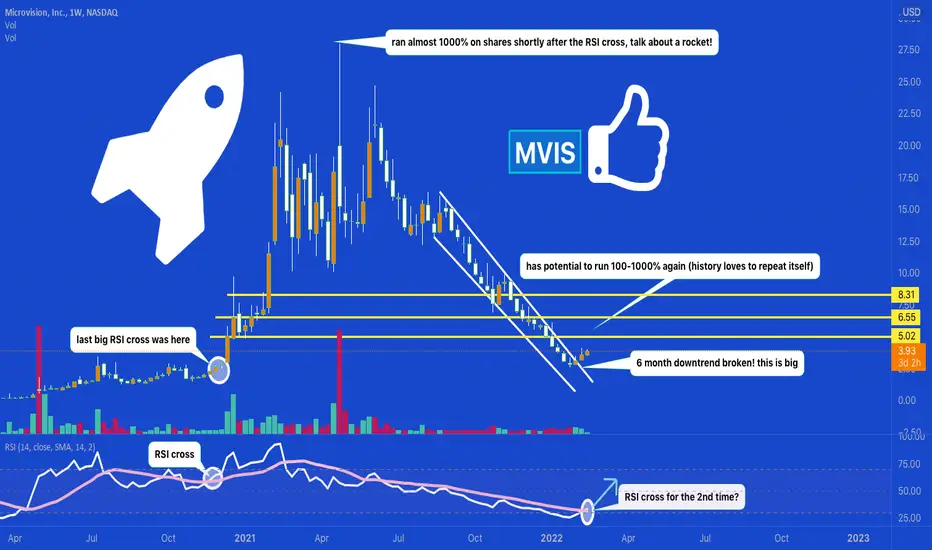
loving this setup! on my watchlist this week 🔥MVIS recently broke this 6 month downtrend channel, also look at the RSI cross its making.
The last time we saw a RSI cross it rallied around 1000% in a very short period. theres no guarantees history repeats.. but a small rally is definitely possible here. My short term price targets if we can break 4 round number resistance: 5.02-6.55-8.31
like and follow for more! 💘
MVIS boom incoming?Not a financial advisor.
MVIS had a historic run and made a lot of news headlines last year.
We appear to have seen the bottom and look for a 3 white soldier reversal to confirm the strength upward.
This was one of the best plays for volatility in the market with the price swings. Also had major booms in the market seeing major price increases.
This is certainly one to keep an eye on in Feb. You may never see these price levels ever again.
All indicators are curling up and the Parabolic Sar has flipped bullish. This is one of my personal favorites due to its history of major price spikes. Definitely watchlist worthy.
Lidar, Augmented reality
plenty of eyes will be watching this one closely. I anticipate this to be a headliner again for 2022.
This should be back up to $8 in a matter of weeks.


More Pain on the WayBased on the presentation that was presented today (Jan. 5th 2022) this stock will be heading to the supply zone on the chart. Currently holding some shares that I will diamond hand. Looking to average down when the time is right. I believe company will achieve greatness but will take some time.


MVISWe are getting ready for a huge rally, let see where we go, strap on tight we are going to 100$+

Buy $MVIS - NRPicks 08 OctMicroVision, Inc. develops lidar sensors used in automotive safety and autonomous driving applications. Its laser beam scanning technology is based on microelectronic mechanical systems, laser diodes, optomechanics, electronics, algorithms and software.

MVIS LongTrendline break
Demand Zone confirmation
Entry 9.14
Stop 8
Target 15
Risk management is much more important than a good entry point.
I am not a PRO trader.
In my trading plan, the Max Risk of each short term trade should be less than 1% of an account.

$MVISThrough red resistance box and likely target 1.618 fib and would have me thinking about new uptrend

MVISAn inverted hammer was formed last week, it was with GAP, and the candle formed a long shadow, meaning buyers were aggressive and raised the price to a higher level, but sellers took control on the last day of the week. From a technical point of view, it can be said that the price has a chance to rise, because according to the stochastic indicator the fastest K is 2.14 and the shortest is 3.09. Also, if a stochastic crossover forms this week or next, which could be a serious signal to take a step. So the price has dropped and now this stocks have a good price level which can be attractive to the buyers.
In line with the downward trend, the expected price may fall to 8.30 or even 7.50, as such a price was only maintained in 2011. And that’s the old level of support. Previously, this price level was February this year, but that week the price just jumped during the week. So the price doesn’t have a new support level.
But better wait a week or two and see what happens.

Speculative idea of the market now through 2023 This is a totally speculative idea but makes sense using harmonics. Right now we will get a pump but will sell off in February. Another pump in April then sell off in the summer then the cycle continues with a pump in November 2022 again..

End of april revisited?Elon testing lidar after denied is was needed!
Volvo installing lidar , not mvis, anyway all lidar companies back in the game.
Lots of big car companies-customers!
