Mvis is getting ready to explode Double bottom has been formed we will see a huge push up! Get ready buy your tickets to the moon 🚀🚀
0K17 trade ideas


$MVIS holding support here.$MVIS Tested support area, and bounced off of it nicely. Setup nicely on this bullish formation. Liking the price here for long term, anticipating a breakout for the long run to new price highs.
Support: 10
B/O: 17
Short Term Target: 21
Short Term Target: 31

MVIS Ready?Not and advisor.
Ladies and Gentlemen please buckle up, we just triple bottomed and may be preparing for lift off. Last few times MVIS rocketed up, it has been 400%. I'm not sure we get that this time. I'm hopeful don't get me wrong, RSI has really cooled off in which we should see it rip up like crazy again here. Exciting times to be in MVIS.

Is it about to take off ?Looks like a pennants about to break upwards to me. Maybe by the end of this week or the next one we will be fixed.
Let me know what are your thoughts on that.

MvisHad many fake breakouts. Seems
To be rollin over as of late but could be either a cup and handle formed, or a last needed bounce off lower trendline. Either way this is on the watch list. I’ll try to toss up a post if I see it breaking out. It’s been on my watchlist

MVIS - Two buy zones for you!You can buy in this zones. First zone is a small support where you can establish a small position. We can also see a break through current level of support and retest 2. Buy zone (support) again. Long term stock for me!!!


MVIS Chart riding into the LiDAR Sample in AprilSo very clear reverse head & shoulders pattern playing out here. LiDAR Sample a few weeks out. Volume is rather low here, we have an opportunity to breakout soon. Day to day we are seeing some pretty significant price swings, RSI isn't impacted by that much either. Good for bullish divergence. I believe we see a quick break in profit taking and explode up further. I firmly believe if BO happens its early may, listening into Sumit talk during the last earnings call actually had me pretty jacked and ready for April to get here. However we need these companies to be blown away by the "Best in Class" LiDAR. Years ahead of the competition, that will play a vital role in stock price come April. For the time being we have low volume and politics keeping us down, but in a pattern that can bring some nice gains to those who time an entry properly, and wait for the right sign. GLTAL

MVIS - Can we build a range?If the support works, we could create a range between the two distinctive levels. Nevertheless, the chart is difficult to assess. Such upward outbreaks no longer have anything to do with a normal chart analysis. I hope for a healthy range so that buyers and sellers agree on a nice price range. Then the cards are reshuffled.

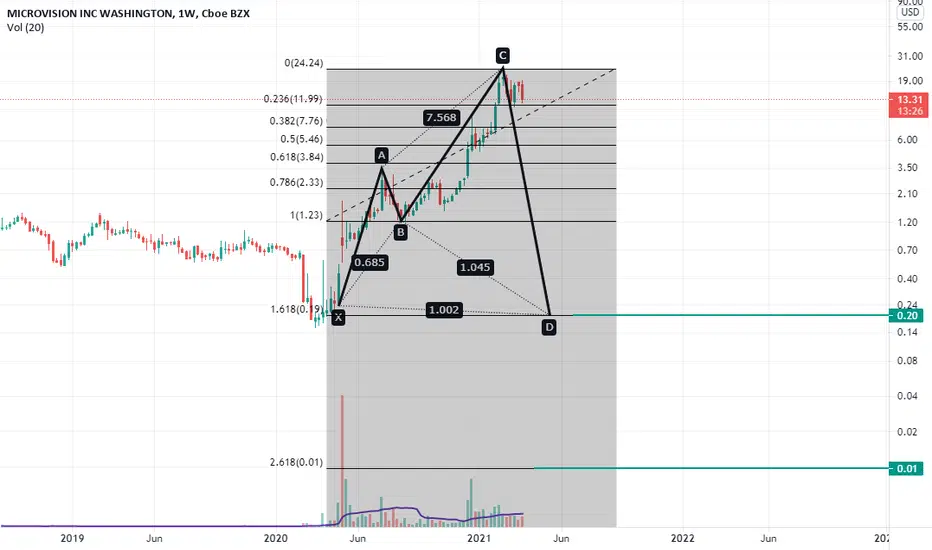
MVIS: Double bottom (46%), Bullish pennant (138%)Primary Target (short term):
Double bottom (46%)
PT = 26.06$
Secondary Target (Long term):
Bullish pennant (138%)
PT = 33.91$

MVIS - Consolidations don’t scare meKept it basic and simple this time. We had good price action and movement. Multiple trend lines and formations are being confirmed. We’ll have to see how things unfold over the next few weeks. None the less, I still maintain we will be over $100 by the end of the year, with a high possibility of seeing $30 in the coming weeks.

$MVIS shares soar after Microsoft's $22B HoloLens contractMicrovision shares soar after Microsoft's $22B HoloLens mixed reality headset contract with the U.S. Army contract
Microvision, once rumored to be an acquisition target for Microsoft, is reportedly a supplier for the HoloLens 2 models.
seekingalpha.com

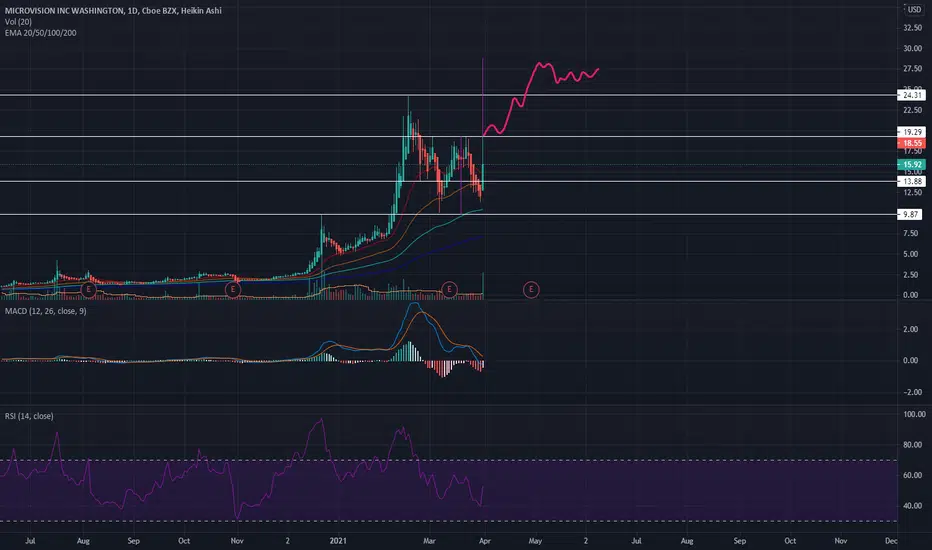
MVIS Daily chart looks really bullish. MVIS daily chart looks really bullish as the MACD is about to turn green, and the RSI is heading up. Today we saw a move up and high volume if you look at the volume. It sort of looks like a double bottom and we can see a breakout and a nice move up. Heard there was some sort of news that caused the move today but haven't been able to find anything.

prediction off double bottom and news MSFT had great news that impacts MVIS and MVIS's chart is very pretty just looking for a close over $19 imo for the double bottom to really be in play. i feel like a lot of people got in on this

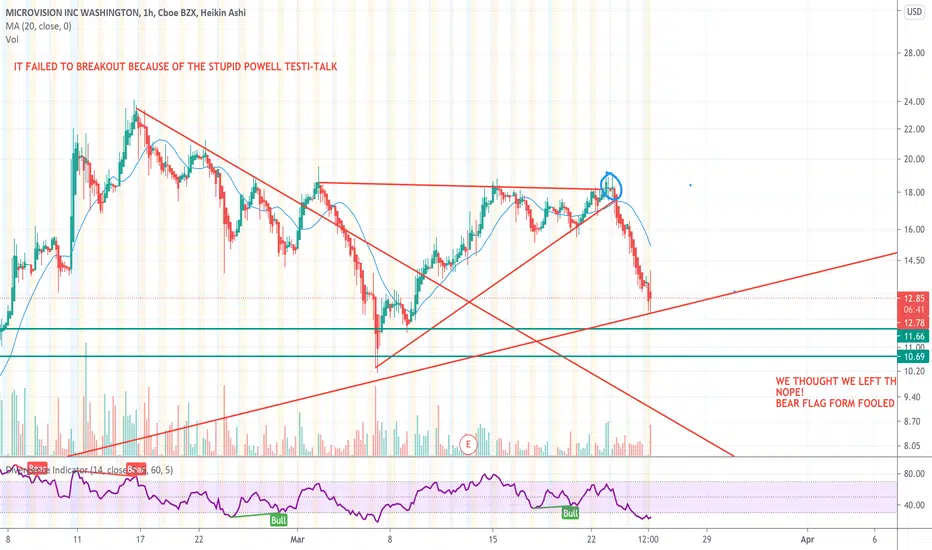
MVIS SHORT TERM ANALYST READING 2Clearly the last breakout was a bust from the bearish flag, but we seem to see the cool down on selling pressure, but this can spark the next stage to the market cycle as a whole, the Euphoric phase ended, now beginning the final steam to push it up before it becomes a double top (unless proven wrong otherwise).

Intraday check-in on MVIS 30 min chartTook some time to go over MVIS and what I’m looking at. The Market still plays a roll on our price action. It has nothing to do with a lack of value in the company and/or products the produce. Shorts have used the crumbling market as a tool to drive price down further.
It appears we may have hit a double bottom around $12.56 - $12.57, but hit a hidden dynamic resistance I discovered while making this recording. We’ll have to see now if we have true support around $12.56, or if we continue down further. Regardless, you all should have dry powder available to buy some more shares. These lows are a gift, so treat it as such.
One thing I didn’t discuss in the video, was the IH&S (Inverse Head & Shoulders). If the fundamentals and market line up, the IH&S would have given us Bullish momentum to break trend up to the $20 range.
BTFD, BAFF, and BOOMSKI UPSKI TO THE MOONSKI everyone.
If you think I missed something, as always, I’m happy to learn.

MVIS - 4HREntering a position here and adding on green supports. Hopefully the bottom is in for EV stonks. not financial advice.

MVIS poised to retest highs ~ 25This chart is one of the best medium term charts I see. Beautiful looking invere H&S forming with a neckline around 19. Cracking this would allow it to retest the previous highs around 25/26. Very strong looking to me. I am playing with Apr 15 and Apr 20 calls.

Predicting Future Price Targets In the last correction, it took 6 days for the run up to top out at the last ATH $9.74 (beginning from when the price started gapping above the Bollinger Bands).
When we measure from the bottom of the dip to the last ATH ($4.56 - $9.74), duplicate the measurement, and reposition it start at the close of the last ATH ($9.27), we end up exactly where the price landed after 6 days the beginning of the most recent run up. What is denoted by the purple box is further pumping of price due to MVIS news.
If we use the same technique starting from the dip to the ATH ($10.12 - $24.18), duplicate the measurement, and reposition it at the close of the ATH ($23.71), we get a price target of $37.77.
We are currently at day 6 of 8 after the Bollinger Band contraction.
