OKTA Options Ahead of EarningsIf you haven`t bought OKTA before the previous breakout:
Now analyzing the options chain and the chart patterns of OKTA prior to the earnings report this week,
I would consider purchasing the 85usd strike price Calls with
an expiration date of 2025-5-16,
for a premium of approximately $7.95.
If these options prove to be profitable prior to the earnings release, I would sell at least half of them.
0KB7 trade ideas

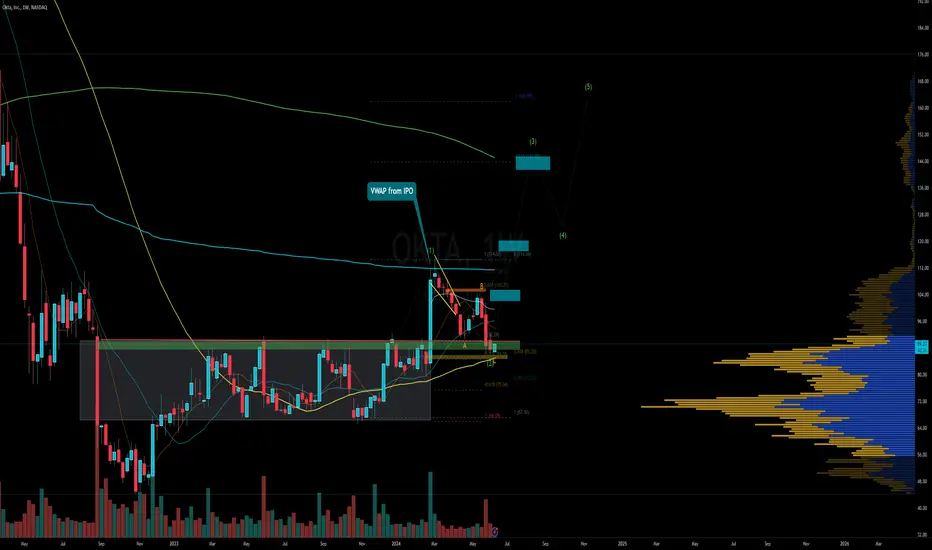
OKTA analysis#OKTA looking good on the alltime-chart.
Expecting turnaround in near future.
Short timeframe no clear bottom formation visible yet.
Big picture very clear. Elliott-Waves adding up nicely.
61.8% Fibonacci-Retracement hit perfectly on log-chart.

$OKTA - Bargain or a falling knife?Okta ( NASDAQ:OKTA ) is trading inside a descending broadening wedge and starting to form a base from which it could launch.
However, there is a risk that breaking below the current support level could be disastrous for the stock. Knowing that risk, would you bet on it?
This earnings report (ER) is going to be a make-or-break event for the stock.
Targets are shown in the chart.
As always, I share my opinions and trades. I'm not suggesting that anyone follow my trades. You do you.

Okta - identity crisis?We appear to be in an Expanding Diagonal pattern. I believe Okta still has some room to go and we should get a final wave to the upside.
Currently we are in correction territory and so there may be an opportunity to go long here. The ideal entry will be around the golden fib retracement and within the Expanding Diagonal support confluence.
I am merely bringing this to your attention, keep an eye on it. Not financial advice

OKTALooks like $94 to 96 move is possible within the next couple of weeks provided market holds steady. Not a recommendation.

OKTAI bought OKTA several months ago, after the flat - gap up - and after some pullback.
An evident mistake. ALthough, seems like it is printing a diagonal structure, and has decent long-term potential. In anyway, will exit as soon as price reaches my entry level

OKTA Buy while cheapEntry at or above 90
Stop loss 83.80
Safety Target 96.20
Look for at least 10 to 1 to final target

OKTA - Time to go long?This is my 2nd stab at OKTA Long trade.
It filled the Gap below from the last earnings Gap up and seeing a bid here today.
Starter long entry anywhere here 85-90, if it holds 90 this time, we can add more position size.
Target#1 - 100
Target#2 - 120
Target #3 - 144, after some drama
Stop Loss - below 85
OKTA retesting the critical resistance at 87After a good breakout, price is retesting that important resistance at 87 the stock rejected 5 times last year. That also coincides with the 200MA. Strong confluence.
If that can successfully be flipped to support, it will be very constructive for the stock for the next few months.
Watching and will consider a long above 91.
From there 115 is first target followed by 150 area.

Okta Shares Down 6.21% On Q1 Fiscal Year 2025 Financial ResultsOkta ( NASDAQ:OKTA ), the leading independent identity partner, has announced its financial results for the first quarter of fiscal year 2025. The company reported a 19% year-over-year increase in Q1 revenue and a 20% year-over-year increase in subscription revenue. The current remaining performance obligations (cRPO) also increased by 15% to $1.949 billion. The company's CEO, Todd McKinnon, stated that the company began the new fiscal year with record non-GAAP profitability and cash flow.
The total revenue for Q1 was $617 million, an increase of 19% year-over-year. Subscription revenue was $603 million, an increase of 20% year-over-year. The RPO, or subscription backlog, was $3.364 billion, an increase of 14% year-over-year. The cRPO, or subscription backlog expected to be recognized over the next 12 months, was $1.949 billion, up 15% compared to the first quarter of fiscal 2024.
GAAP operating loss was $47 million, or 8% of total revenue, compared to a GAAP operating loss of $160 million, or (31)% of total revenue, in the first quarter of fiscal 2024. Non-GAAP operating income was $133 million, or 22% of total revenue, compared to a non-GAAP operating income of $37 million, or 7% of total revenue, in the first quarter of fiscal 2024.
GAAP net loss was $40 million, compared to a GAAP net loss of $119 million in the first quarter of fiscal 2024. Non-GAAP net income was $117 million, compared to a non-GAAP net income of $38 million in the first quarter of fiscal 2024. Net cash provided by operations was $219 million, or 36% of total revenue, compared to net cash provided by operations of $129 million, or 25% of total revenue, in the first quarter of fiscal 2024. Free cash flow was $214 million, or 35% of total revenue, compared to $124 million, or 24% of total revenue, in the first quarter of fiscal 2024.
The company's financial outlook for Q2 is expected to be stable but challenging, with growth rates of 13% to 14% year-over-year. For the full year, the company expects total revenue of $2.530 billion to $2.540 billion, with non-GAAP operating income of $490 million to $500 million, a non-GAAP operating margin of 19% to 20%, and a non-GAAP free cash flow margin of approximately 22%.
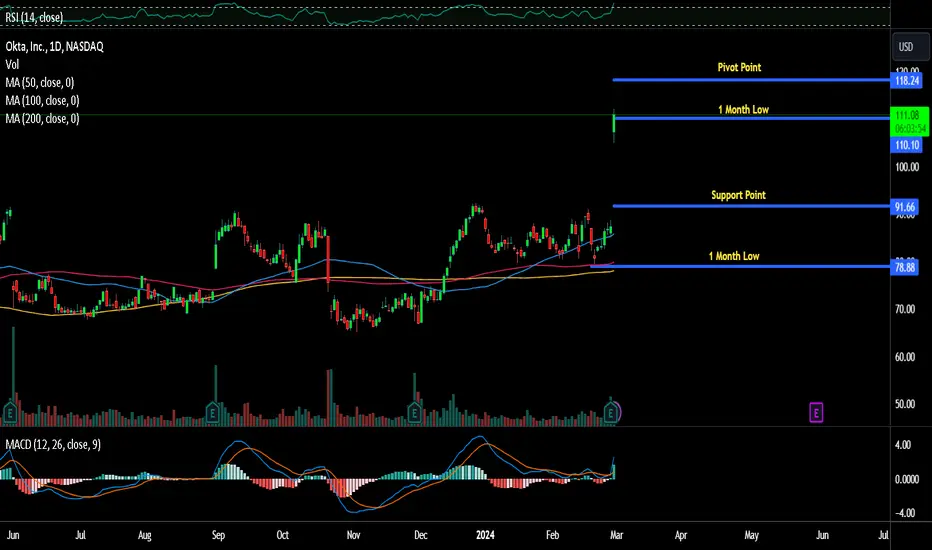
Technical Outlook
Okta shares is down 6.78% as of the time of writing trading with a weak Relative Strength Index (RSI) of 30.61 which is currently oversold. Due to the "Golden Cross Pattern" on the 11th of January, NASDAQ:OKTA shares surge to local monthly highs. The daily price chart depicts a long "Bearish Harami" candle stick pattern.

$OKTA #OKTANASDAQ:OKTA #OKTA is currently testing a significant level where a couple of broken wedges are being tested.
For this one, I may reinforce the analysis later on with some more insights early next week.
#AHMEDMESBAH

Descending Wedge on Daily ChartOKTA was bullish and formed descending wedge on correction. If this plays per book we might see a pop. First level to look out would be 104 if it breaks 102 tomorrow and if it breaks 98 this might be invalid

OKTA watch this one closely for a surprise popWatching this gap fill as it slowly pulls back to 50DMA.
Build long slowly based on broader market condition, don’t jump all at once.
Long between 92-95-98
Stop loss - 90
Target#1 - 110
Target#2 - 125

Okta Surges on Stellar Earnings: Riding the Cloud Identity WaveOkta Inc. ( NASDAQ:OKTA ) catapulted 28% in after-hours trading following its impressive quarterly performance, surpassing analyst estimates and raising its full-year sales forecast. The cloud identity software company's robust growth, fueled by a surge in larger enterprise customers, underscores its pivotal role in modernizing identity infrastructure and simplifying organizational processes.
For the fiscal fourth quarter, Okta ( NASDAQ:OKTA ) reported a remarkable 19% revenue increase year-over-year, soaring to $605 million, outpacing analysts' expectations by a substantial margin. Adjusted earnings of 63 cents per share further solidified its position as a market leader, surpassing the consensus of 51 cents per share. Notably, Okta( NASDAQ:OKTA ) added 120 customers in the quarter with a minimum annual contract value of $100,000, reflecting strong demand and expanding market reach.
"We’re pleased with the strong top-line performance, driven by strength with large customers. Organizations continue to turn to Okta to help modernize and simplify their identity infrastructure," stated the company in its earnings report, highlighting the growing reliance on its solutions among enterprises seeking enhanced security and efficiency.
Looking ahead, Okta ( NASDAQ:OKTA ) provided an upbeat outlook, projecting current-quarter revenue between $603 million and $605 million, surpassing analyst estimates and indicating sustained momentum in its business operations. Additionally, the company raised its full-year revenue forecast to a range of $2.495 billion to $2.505 billion, demonstrating confidence in its ability to capitalize on market opportunities and drive sustained growth.
The impressive earnings report also signifies Okta's resilience in the face of challenges, notably a significant security breach last year. Despite this setback, the company's financial performance remains robust, indicating its ability to navigate adversity and emerge stronger.
Analyzing Okta's ( NASDAQ:OKTA ) share price on the weekly chart reveals a notable breakout amid earnings-driven momentum. However, potential overhead resistance zones at $108 and $145 merit close monitoring, representing key areas where the stock may encounter selling pressure based on historical price action.
As Okta ( NASDAQ:OKTA ) shares surged to $107.61 in after-hours trading, investors are buoyed by the company's stellar performance and optimistic outlook. With its strategic positioning in the rapidly evolving cloud identity market and a strong foundation of enterprise customers, Okta is poised to sustain its growth trajectory and redefine the future of identity management in the digital era.
OKTA: Confident Growth Amid Decreasing Short InterestOkta, Inc. (NASDAQ:OKTA) , a leading provider of cloud identity and access management services, attracts investors' attention with its potential for sustainable growth and a noticeable decrease in short interest volume. The reduction in short interest is a positive signal, indicating a decrease in pessimism among investors regarding the company's future prospects, which could be a harbinger of an increase in stock value.
Okta continues to demonstrate strong results, thanks to its innovative platform that provides secure and convenient access to applications and services for organizations of various sizes. In a context of growing demand for cybersecurity and identity management solutions, Okta strengthens its market position by expanding its product portfolio and entering new segments.
The decrease in short interest volume may indicate that investors are becoming more confident in the company's ability to overcome current challenges and realize its growth potential. It may also suggest anticipation of positive news or improvement in financial results, which could push the stock price up.
Additionally, Okta invests in expanding its global infrastructure and developing technological innovations, allowing the company to maintain a high level of competitiveness and meet changing market demands. These strategic initiatives, combined with improved market perception as reflected in the decrease in short interest, create a solid foundation for long-term growth in stock value.
For investors looking for opportunities in the technology sector with sustainable growth potential, OKTA shares represent an attractive option. The decrease in short interest, coupled with strong operational indicators and a strategic focus on innovations and expansion, offers positive prospects for long-term investors.

OKTA Stock Chart Fibonacci Analysis 021124Trading Idea
1) Find a FIBO slingshot
2) Check FIBO 61.80% level
3) Entry Point > 85/61.80%
Chart time frame : D
A) 15 min(1W-3M)
B) 1 hr(3M-6M)
C) 4 hr(6M-1year)
D) 1 day(1-3years)
Stock progress : A
A) Keep rising over 61.80% resistance
B) 61.80% resistance
C) Hit the bottom
D) Hit the top
Stocks rise as they rise from support and fall from resistance. Our goal is to find a low support point and enter. It can be referred to as buying at the pullback point. The pullback point can be found with a Fibonacci extension of 61.80%. This is a step to find entry level. 1) Find a triangle (Fibonacci Speed Fan Line) that connects the high (resistance) and low (support) points of the stock in progress, where it is continuously expressed as a Slingshot, 2) and create a Fibonacci extension level for the first rising wave from the start point of slingshot pattern.
When the current price goes over 61.80% level , that can be a good entry point, especially if the SMA 100 and 200 curves are gathered together at 61.80%, it is a very good entry point.
As a great help, tradingview provide these Fibonacci speed fan lines and extension levels with ease. So if you use the Fibonacci fan line, the extension level, and the SMA 100/200 curve well, you can find an entry point for the stock market. At least you have to enter at this low point to avoid trading failure, and if you are skilled at entering this low point, with fibonacci6180 technique, your reading skill to chart will be greatly improved.
If you want to do day trading, please set the time frame to 5 minutes or 15 minutes, and you will see many of the low point of rising stocks.
If want to prefer long term range trading, you can set the time frame to 1 hr or 1 day.

OKTA - 2x Potential OKTA has been in a tight range for a long time.
Got rejected many times at 92 level.
If this breaks and holds above 92 level, go long.
Long above 92
Stop loss - 80
Target #1 120 (30%)
Target #2 184 (96%)
and after some pullback
Target #3 220 (135%)
Above 130, this doesn't have much resistance until 220.

OKTAOkta, Inc. is an American identity and access management company based in San Francisco. It provides cloud software that helps companies manage and secure user authentication into applications, and for developers to build identity controls into applications, website web services and devices.
Strong price action within a consolidation range.

OKTA: Poised for Growth at Key Levels"?OKTA. is a leading identity and access management company that provides cloud software to help businesses manage and secure user authentication into modern applications, and for developers to build identity controls into applications, website web services, and devices. Founded in 2009, the company has been instrumental in pioneering identity solutions fit for a cloud-first, mobile-first world.
As of now, Okta's stock is at crucial levels, signaling a potential breakout or pivot. The company has been posting strong earnings over the last few quarters, indicating robust operational performance and growth prospects. This positive momentum sets the stage for today's earnings announcement, which is widely anticipated to be favorable.
In terms of stock targets, after surpassing the pivotal $74 mark, the next key levels to watch for are $77, followed by $79, and then $82. These target levels could serve as either resistance points or new support levels, depending on investor sentiment and market dynamics.
Investors and traders are keenly watching Okta, especially given its recent performance and today's crucial earnings release. With strong fundamentals and optimistic market sentiment, Okta appears well-positioned for potential upward movement.

$OKTA - Huge ConsolidationNASDAQ:OKTA Daily:
Currently rangebound with no clear direction. I'm anticipating two scenarios with respect to the 200 DMA:
1. Base on the 200 DMA, consolidate, then trend up around ER at February end.
2. Drop below 200 DMA, but rebound from range bottom. This coincides with potential market weakness in February.
In both cases, I expect OKTA to test range top, with ER potentially triggering an explosive move.
Bullish thesis: For the full year of 2024, Okta expects to make about $2.24 billion, which is a 21% increase from last year. I expect continued improvements in other financial metrics such as non-GAAP operating income, net income, as well as cash flow measures.

OKTAI think Okta presents a good RR for swing long here with SL under 65 and first target 90. I have added shares around 70 last week

OKTA Options Ahead of Earnings If you haven`t sold OKTA when Losses Exceeding Expectations:
Then analyzing the options chain and the chart patterns of OKTA prior to the earnings report this week,
I would consider purchasing the 72usd strike price Calls with
an expiration date of 2023-9-1,
for a premium of approximately $4.55.
If these options prove to be profitable prior to the earnings release, I would sell at least half of them.
Looking forward to read your opinion about it.

OKTA - High Long Potential - Minimalists AnalysisI'm absolutely NO fundamental analyst.
I literally have no good clue how to read the fundamentals like the Pro's are doing. And I don't plan to learn it in the near future.
BUT...
...I trust my common sense.
The Blue Box explains my common sense thinking and why I see OCTA as a potential buy for the long term.
What I know for sure are my TA skills.
And what I see there is, that price respects the L-MLH of the Andrews Pitchfork.
The Green Box shows the support range.
If you zoom closer you see the "Trigger" bar (green) which started the up-move.
The Blue Boxes are just for myself. I cut out the noise by splicing the inside bars and outside bars to one block. That makes the chart reading easier.
What else do we have in the TA arsenal?
The MACD and the Mansfield RS.
You probably know what the MACD projects.
The Mansfield Relative Strenght is not known very widely. Nonetheless it does it's job by measuring the evolution of OCTAs price compared to the SPX over an average of 52 periods by default.
So, bringing it all together:
If price don't drop below the Forks lower line (The L-MLH or Lower Medianline Parallel), AND both, MACD and Mansfield are positive AND the volume starts to rise furious, then my Gatling fires from all guns. §8-)
Wish you all a happy weekend.
