0KDU trade ideas

OSTK- Update Oopsies to previous postApolgies for my OSTK chart.. I went back to look at it and had my harmonic tail at wrong spot.. WOW
Way off. but we can see here - with Fibs that the potential has been reached. It shocked me as well to see the stock go up beyond, but just dawned on me today the Harmonic was drawn wrong. Update is here.

Bottom side to 85s upside to 108 - 115searching opportunity to ride this monster.
Going in at around 85s with 108 and 115 for profit

OSTK and TZOO 2011 TwinningAlmost decades apart, but similar psychology.
Note corrective pullbacks from past peaks. They pull back more and more until a new 52 week high is achieved and eventually attracts the crowd again.
TZOO did not fare well after the 2nd peak.


4th cup and handle forming?3 cup and and candles formed and broke out. Need a pull back here to form the forth and to send this to the moon! Thinking we come back down to $75-$80 then launch off.


OSTK- Bull momentum over?The way this is playing out it appears OSTK could be approaching a severe downward trend in the next week.
Opening bell on Monday 8-3-2020 could be a surprise to long term holders. If we do see further upside it will not be for much longer...but I think this may have sung its last song.

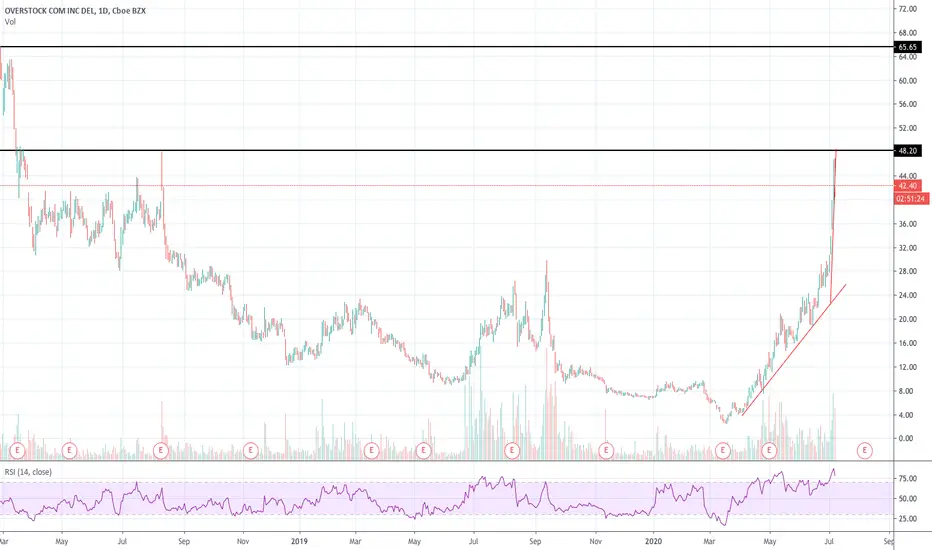
Buy OSTK once it starts trading above 48.5OSTK has crucial resistance at 48.50. Once stock starts closing above this level then high probability of going towards 65 and 82. Currently stock is overbought state.


Picking the top or being humbledOverstock has definetly gone parabolic, 2500% in 5 months.
- Double Top
- RSI massively oversold and in line with previous parabola (though slightly early)
- Massive weekly panic buying candle
Perhaps the more disciplined play would be to wait for bearish RSI Divergence (yellow lines) but it feels like when this goes it will be fast.

Overstock - History will repeat PT: $30The Monthly - Weekly indicators telling that Overstock is overbought.
We think that a pullback to at least $40 will happen.
First PT: $50.
Second PT: $30.


$OSTK Earnings tomorrow. What a run so far!Let's see what TZero and the old internet retail business do next!

$OSTK:NASDAQ - OVERSTOCK COM - Big run. Pulled back.Overstock could be interesting to watch over the next couple of days. Down around 20% from its recent highs but up a crazy 1500% since early to mid March. I'd be interested if it made it back up above $45 to see if it will continue its run. Needs a pretty wide trail.


Possibly a Parabolic ArcTrend lines point to the dreaded ARC
Just y opinion and we all have one (o:u


OSTK cup and handle Triple cup and handles are way better than a double rainbow. OSTK made and broke out of 2 cup and handles already. Just retraced to make a third on a long time frame. OSTK price target $85

