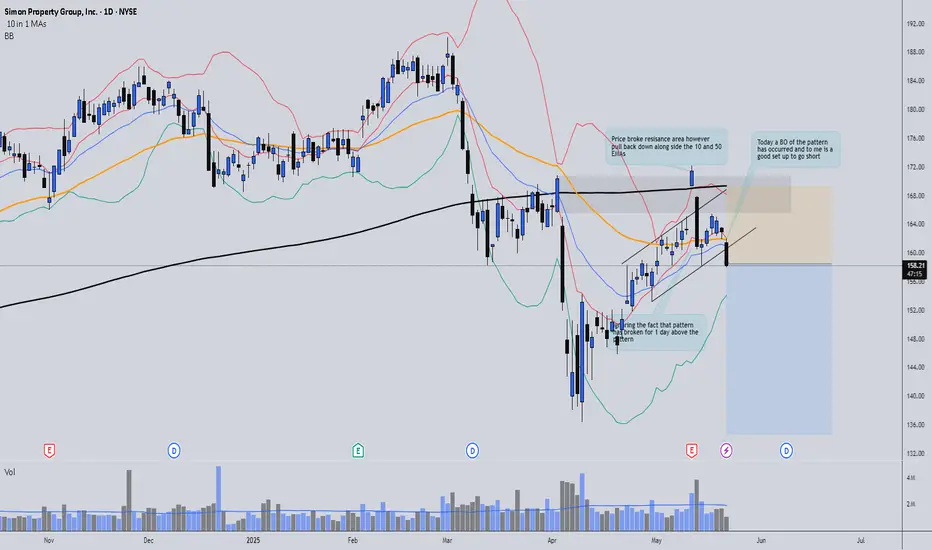
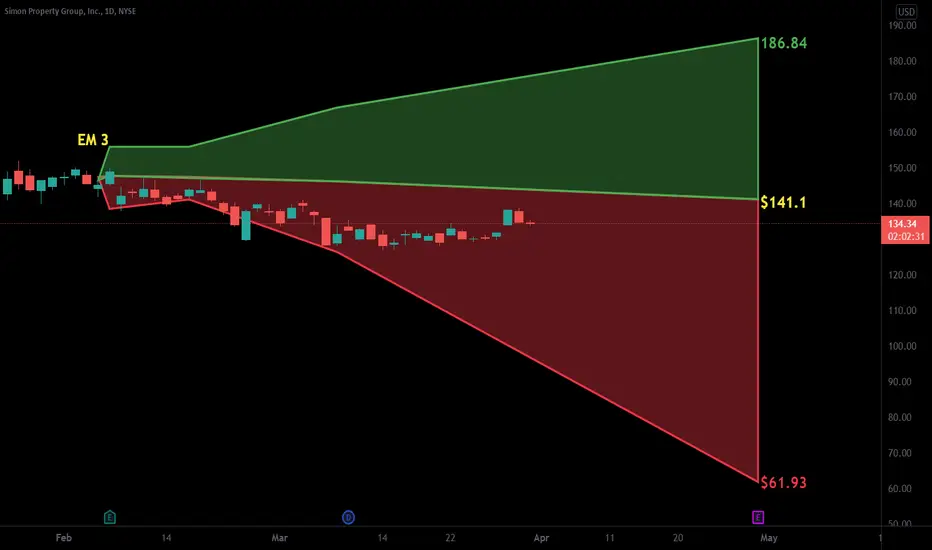
SPG Short sellSPG has been reacting correctively to the upside, which suggests that bullish interest is fading and sellers are gradually taking control.
While the price briefly broke out of the pattern to the upside, that move lacked conviction and quickly reversed, indicating a false breakout. The price then re-entered the pattern and today decisively broke down with a strong bearish move.
Although the volume on this breakdown isn’t very high (which is a concern), the overall price action signals that sellers are stepping in more aggressively.
As long as SPY remains in a pullback phase and lacks bullish momentum, I’m maintaining a bearish outlook on SPG, at least until the broader market regains strength.
0L6P trade ideas
SPG breakout within the next 9 monthsSPG has been consolidating since late 2018. I predict a break to the upside as the price movement contracts over the next 3-9 months.. SPG currently sits just below the 61.8% fib with strong support at 135.68. A true breakout would occur after 157.72 (61.8% fib).
Notes:
SPG Jan 2026 145.000 call currently has 1,431 open interest as of 7/11/24, trading at 18.78/contract.
The 190 and 200 strike calls are attractive from a TA perspective, but there's not much open interest yet (under 10 contracts) and these may be tough to sell at exit.
SPG Jan 2026 190.000 call currently has 6 open interest, trading at 4.3/contract.
SPG Jan 2026 200.000 call currently has 10 open interest, trading at 3.0/contract.

SPG Approaching A Red Resistance ZoneNYSE:SPG has been in an uptrend since Oct. 2023, and is approaching a red resistance zone. I think there is likely to be resistance ahead, and I would look for an options puts trade setup.

SPG - Trade analysis & Multi-time frame confluenceThis video is more of a tutorial on why I took a short trade on SPG today. We fell out of our strong buying continuation channels with a rejection of HTF tapered channels and selling channels. Confirmation was the support from our more tapered buying algo and rejected of the bottom of our stronger buying algo (in addition to it lining up with our strong magenta selling channel)
Happy Trading :)

SPG: Bearish Harami at Resistance and Bearish Deep Gartley PCZSimon Property Group has formed a Bearish Harami on the weekly at the PCZ of a Bearish Deep Gartley and Bearish Deep Crab, the PCZs happen to align with weekly Horizontal Resistance and may now lead to SPG making its way down to a 0.886 Retrace as the REITs continue down due to rising yields.

Simon Property Group: Bear Flag into Bearish BAMMSimon Property Group is going to close the month below a Bear Flag as the RSI breaks down and the MACD crosses bearishly.
If this Bear Flag plays out, it will begin to push SPG below the B point of this potential harmonic BAMM, which would only complete once SPG reaches the 0.886 at around the $47.30 level. SPG is simply yet another REITs play that I will be on the lookout for a major correction in.

$SPG with a bearish outlook following its earnings #StocksThe PEAD projected a bearish outlook for $SPG after a negative over reaction following its earnings release placing the stock in drift D with an expected accuracy of 100%.

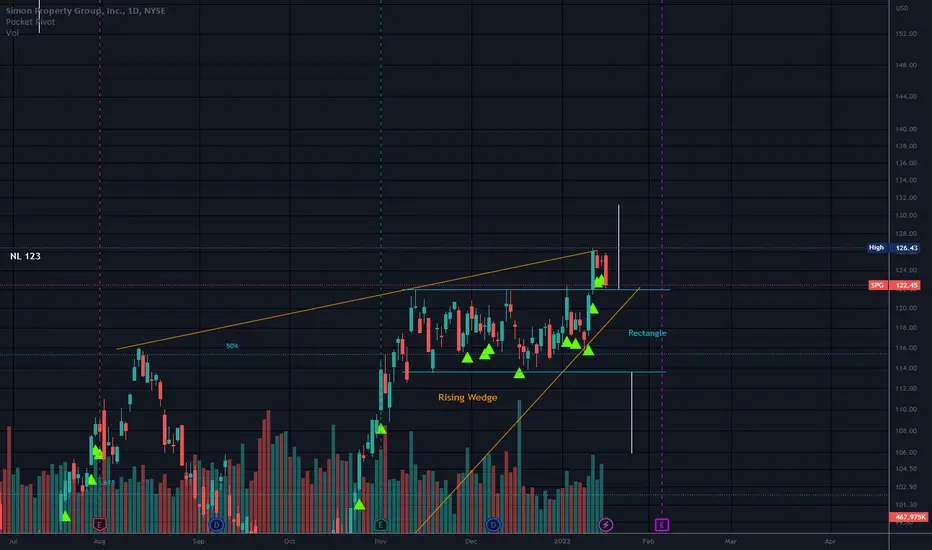
Rising Wedge//RectangleThe latest trend up is traveling in a large Rising Wedge.
The pattern is not valid until the bottom line is broken. Neutral until the bearish rising wedge is broken.
Price is sitting above a rectangle and resting on the top trendline which is now support.
Some would measure the width of the rectangle and project is up and down from the 2 trendlines that bind price action.
Short interest is low at around 1.95%.
No recommendation
$SPG with a Bullish outlook following its earnings #Stocks The PEAD projected a Bullish outlook for $SPG after a Positive Under reaction following its earnings release placing the stock in drift A with an expected accuracy of 85.71%.
Real Estate Blue Chip SPG Simon Property“This is the paradox of public space: even if everyone knows an unpleasant fact, saying it in public changes everything. One of the first measures taken by the new Bolshevik government in 1918 was to make public the entire corpus of tsarist secret diplomacy, all the secret agreements, the secret clauses of public agreements etc. There too the target was the entire functioning of the state apparatuses of power.”
Simon Property Group seeks hyper-privatization of property, by which they can expand their capital and power network
Political outcomes will drive the future for this corporation. Midterms of 2022 will be a catalyst to the upside, but then 2024 presidential cycle holds the true power.

Simon Property Group going back to major support Major Inv C and H on Daily has formed...
The price is having some type of recovery before the price continues down.
It's a conservative entry to enter when the price is below the brim level.
This will confirm the downside to come to around $51.00
Also with Moving Averages - 200 > 21 > 7
Bearish
Target $51.00

$SPG with a Bullish outlook following its earnings #Stocks The PEAD projected a Bullish outlook for $SPG after a Positive over reaction following its earnings release placing the stock in drift B with an expected accuracy of 70%.
SPG - Another Look at the Double BottomSecond post about a double bottom for SPG
This time I have made the double bottom horizontally aligned
Below is my first post for SPG suggesting a double bottom

SPGThe chart is very clear - please follow the instructions on the chart
The chart is very clear - please follow the instructions on the chart
The chart is very clear - please follow the instructions on the chart
The chart is very clear - please follow the instructions on the chart
The chart is very clear - please follow the instructions on the chart
The chart is very clear - please follow the instructions on the chart

$SPG with a Bullish outlook following its earnings #Stocks The PEAD projected a Bullish outlook for $SPG after a Positive over reaction following its earnings release placing the stock in drift B with an expected accuracy of 66.67%.

SPG - Double Bottom Cementing Up ChannelI expect price to form a double bottom from where it is now, continuing the up channel that can be drawn
I prior double bottom can be seen, which led to bullish results

Ugly Top/NecklinesPrice is below the neckline. Look in the rear view mirror as there is a gap that supported price on the last leg down. There is also a small gap not far beneath price and another gap around 83ish where price gapped down after the covid launch )o:.
There is also a Rising Wedge in this chart that still has not been broken and SPF has broken quite a few so far. This rising wedge lies right under 90 for a break of the bottom trendline. Rising wedges create a supply overhang at that level but are not valid unless the bottom trendline is broken.
Drawing the neckline can be most difficult for me. There are different ways to map out a H&S top and you may do this differently than I do.
Some necklines slope up or down, and sometimes there is not 3 distinct tops, or it is not a perfect Head with 2 Shoulders pattern. This one has more than 3, so I call it an ugly top. You may do this differently but I draw a line from the highest point to the neckline, then I apply fib levels. Ugly tops (also known as complex or complicated tops), H&S, triple tops and double tops all have a neckline. If the neckline slopes downward heading to the right, or last shoulder (drawn on chart), I project that line at the end of the last shoulder retracement. The neckline begins at the 1st shoulder retracement.
The neckline connects the 2 arm pits. Straight (or fairly straight) necklines seem to perform best with a distinct head and only 2 shoulders.
Shoulders should be close in height (rarely the exact same price) and about the same distance from the head.
A retest of the neckline often occurs after price falls beneath it. Then I feel fairly certain I drew the neckline correctly as price can not or has major issues breaking it. But price does sometimes and can stay above the neckline for a while, especially during a bull market.
Even after all that work, LOL, it is still just a guesstimate of where price may go. Price may fall 100% or that line I spent so much time projecting downward and applying fib levels, or it may not make it that far. It can also fall even further than 100%. I use the .382, .618 and the .786 for targets 1. Then the 1.272 and the 1.618 for targets 2, but sometimes it is obvious that another fib level may be important like the 1.113 or the .886.
Simply put a fib level on that projected line coming down from the neckline with the 0 at the top.
This pattern performs well in a bear market. The inverse head and shoulders or head and shoulders bottom, has been failing big time as of late, but it does best in a bull market.
SPG is is close to the 100% mark.
The smaller orange type are possible targets 2 if targets 1 are passed.
No recommendation.
A fall below the neckline is not always the last fandango. Any pattern can fail )o:


$SPG with a Bearish outlook following its earnings #Stocks The PEAD projected a Bearish outlook for $SPG after a Negative over reaction following its earnings release placing the stock in drift C with an expected accuracy of 50%.
$spg ready for a nice little runoversold imo.... the malls are back the stock is cheap and everything is getting expensive expect to see a solid pop in spg to the $150's again.

Earnings watch 2/7 post-marketEarnings watch 2/7 post-market:
SPG
BAP
TTWO
CHGG
AMGN
AOSL
RMBS
ACLS
THC
DAC
Do your own due diligence, your risk is 100% your responsibility. This is for educational and entertainment purposes only. You win some or you learn some. Consider being charitable with some of your profit to help humankind. Good luck and happy trading friends...
*3x lucky 7s of trading*
7pt Trading compass:
Price action, entry/exit
Volume average/direction
Trend, patterns, momentum
Newsworthy current events
Revenue
Earnings
Balance sheet
7 Common mistakes:
+5% portfolio trades, capital risk management
Beware of analyst's motives
Emotions & Opinions
FOMO : bad timing, the market is ruthless, be shrewd
Lack of planning & discipline
Forgetting restraint
Obdurate repetitive errors, no adaptation
7 Important tools:
Trading View app!, Brokerage UI
Accurate indicators & settings
Wide screen monitor/s
Trading log (pencil & graph paper)
Big, organized desk
Reading books, playing chess
Sorted watch-list
Checkout my indicators:
Fibonacci VIP - volume
Fibonacci MA7 - price
pi RSI - trend momentum
TTC - trend channel
AlertiT - notification
tickerTracker - MFI Oscillator
www.tradingview.com

SPG - Simon Property Group - BUY at 145SPG - Simon Property Group
Report on 07/02/2022 Real estate operator (mainly shopping malls)
Based on technical analysis on weekly graph the price is currently sitting on 2 support lines (trend and level, which used to be strong resistance lines previously. Also shares are oversold by STOCH and we can see candle pattern pointing on change of trend. All in all I see potential deal in this format:
BUY - @145
Take profit - @170
Stop loss - @133
As of fundamentials:
- Very strong latest quarterly reports. The company is confidently growing its sales and EPS and from the dynamics will probably exceed pre-pandemic data.
- Based on the up to date results of this earnings season, I can make a conclusion that investors are putting more weight on management forecasts on nearest future, rather than the results of last quarter. As COVID restrictions are slowly tending to be removed, so it can give a boost to offline trade, which will positively influence company's results.
- Dividend yield of >4%.
- Multipliers are better than industry average.
- From negative part: High long-term debts, which will negatively influence financial data with upcoming raise of FED key rate. But worth mentioning is the fact that in January SPG has sold $1.2B of senior notes and most of the funds received is planned for repayment of the outstanding debt.

$SPG making a comeback? (3/5)Conviction: 3/5
there may be near-term pullback for better entry
General Thesis
recently bounced off (low confidence) long-term channel
breakout from medium-term resistance (2016)
although a bit of indecision around resistance line
Weekly RSI is high, but did not stop continued rise from 2009 lows
Growth
Margins high and growing
growth is around 50th percentile
Value
P/FCF about 50th percentile
P/S high: about 80th percentile
Fundamentals/Balance Sheet
rising rates could be good for REITs
debt/asset ratio below 1
quick ratio N/A
Potential Risks
expensive market...
